On this page, you can the following information about medical desertification in Romania:
1) An illustrative story about an individual affected by medical desertification in Romania
2) Our country report on medical deserts in Romania
3) A selection of indicators for background information about Romania
4) Our Medical Deserts Diagnostic Tool: maps based on the contextualised set of indicators
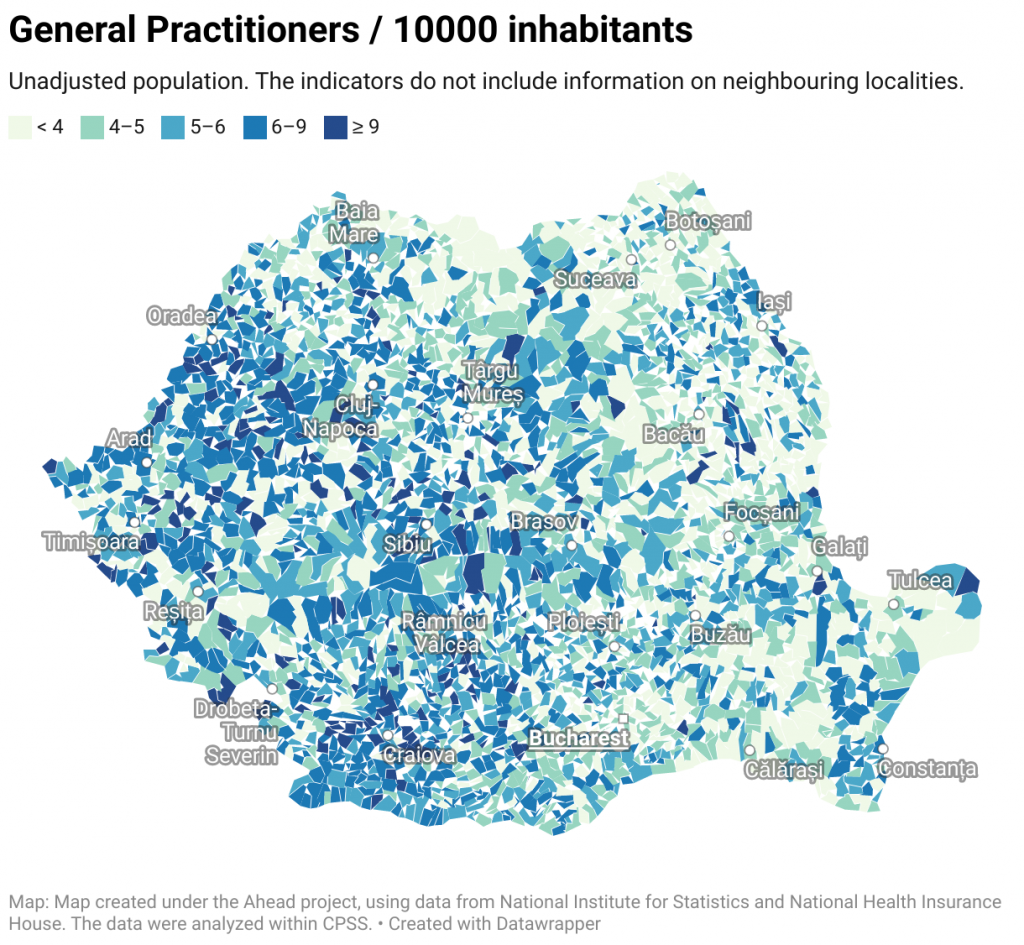
Map 1: General Practitioners / 10000 inhabitants
This is a map of Romania showing the number of general practitioners (GP) per municipality, and per 10.000 inhabitants as a possible indicator of healthcare access.
For more information click on the MAP
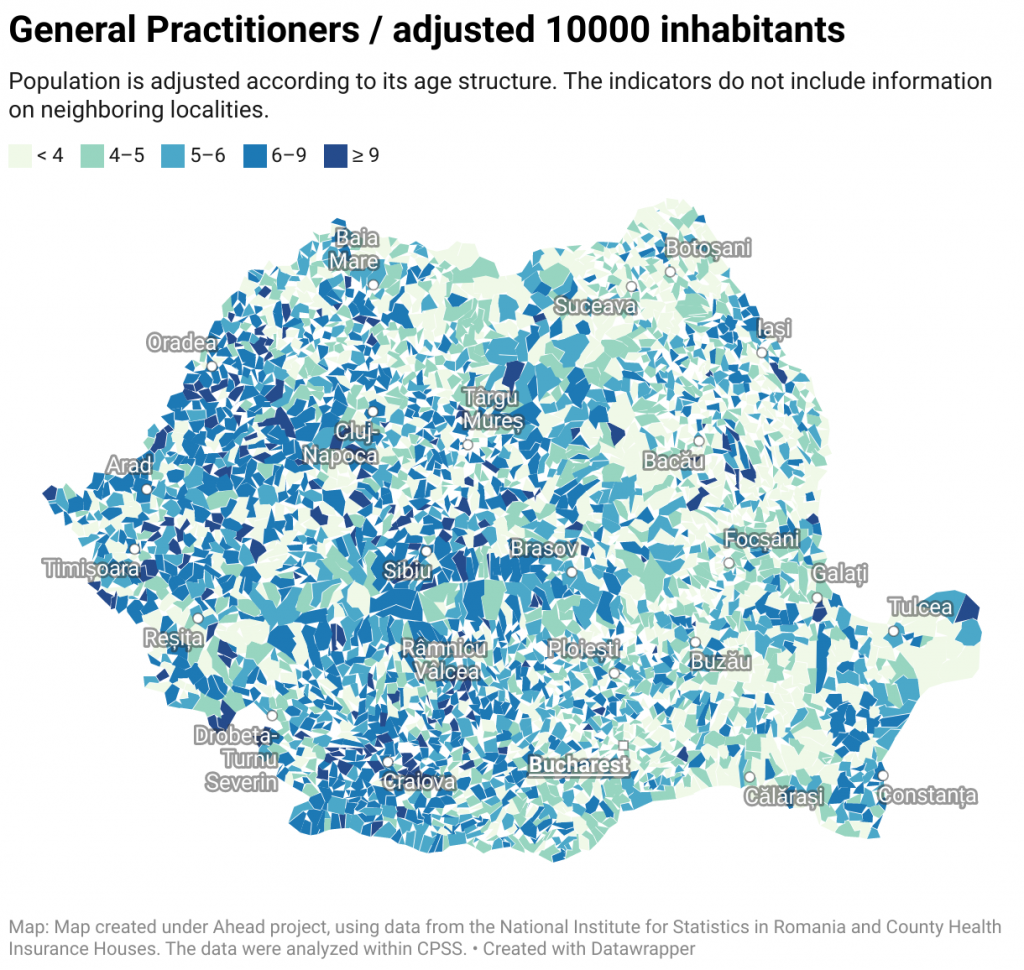
Map 2: General Practitioners / adjusted 10000 inhabitants
This is a map of Romania showing the number of general practitioners (GP) per municipality, and per 10.000 adjusted inhabitants.
For more information click on the MAP!
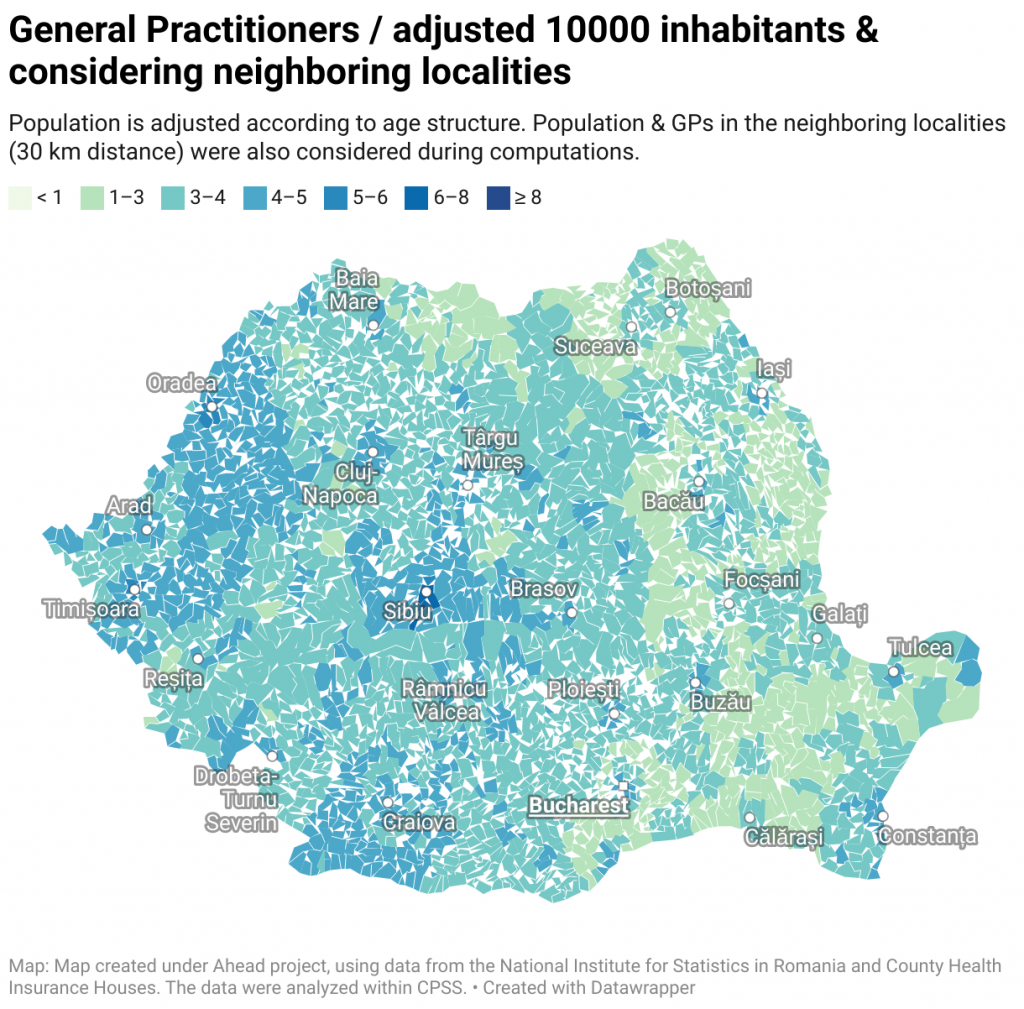
Map 3: General Practitioners / adjusted 10000 inhabitants & considering neighboring localities
This is a map of Romania showing the number of general practitioners (GP) per municipality, and per 10.000 adjusted inhabitants and considering also the supply and demand in neighboring localities.
For more information click on the MAP!
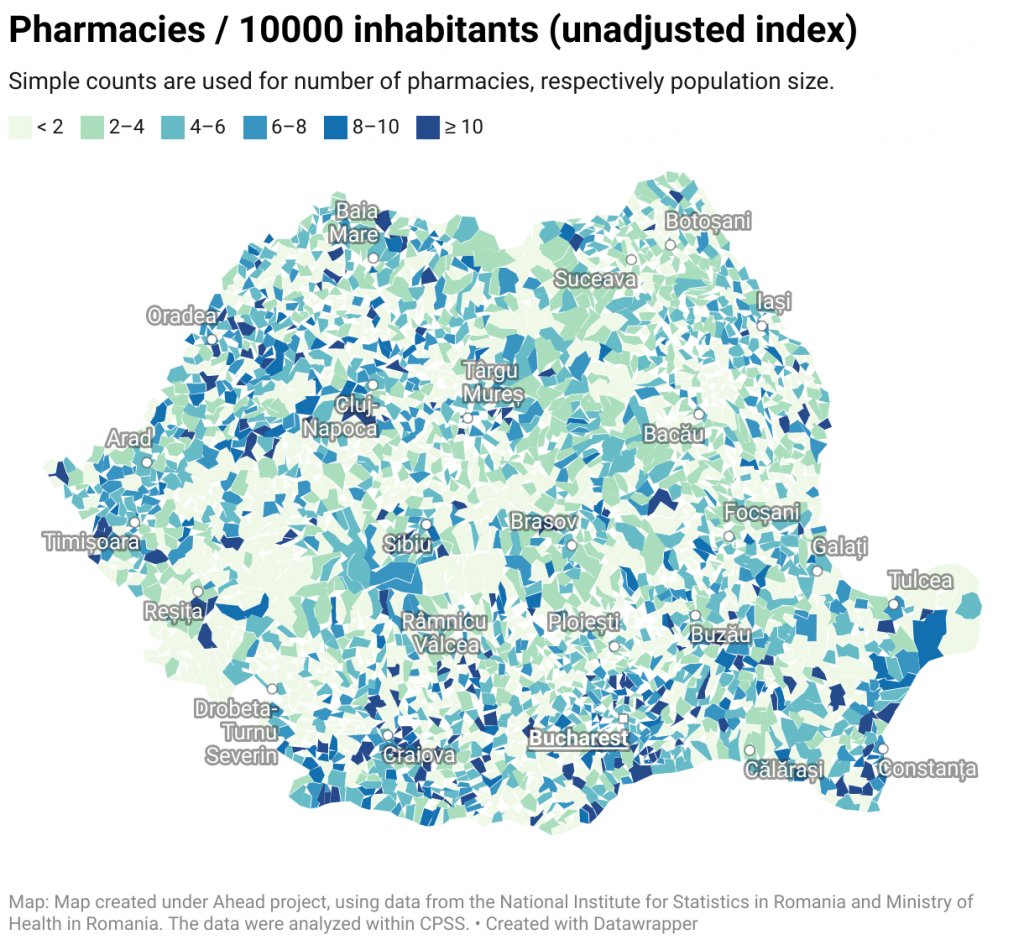
Map 4: Pharmacies / 10000 inhabitants (unadjusted index)
Simple counts are used for number of pharmacies, respectively population size.
This is a map of Romania showing the number of pharmacies per municipality, and per 10.000 inhabitants.
For more information click on the MAP
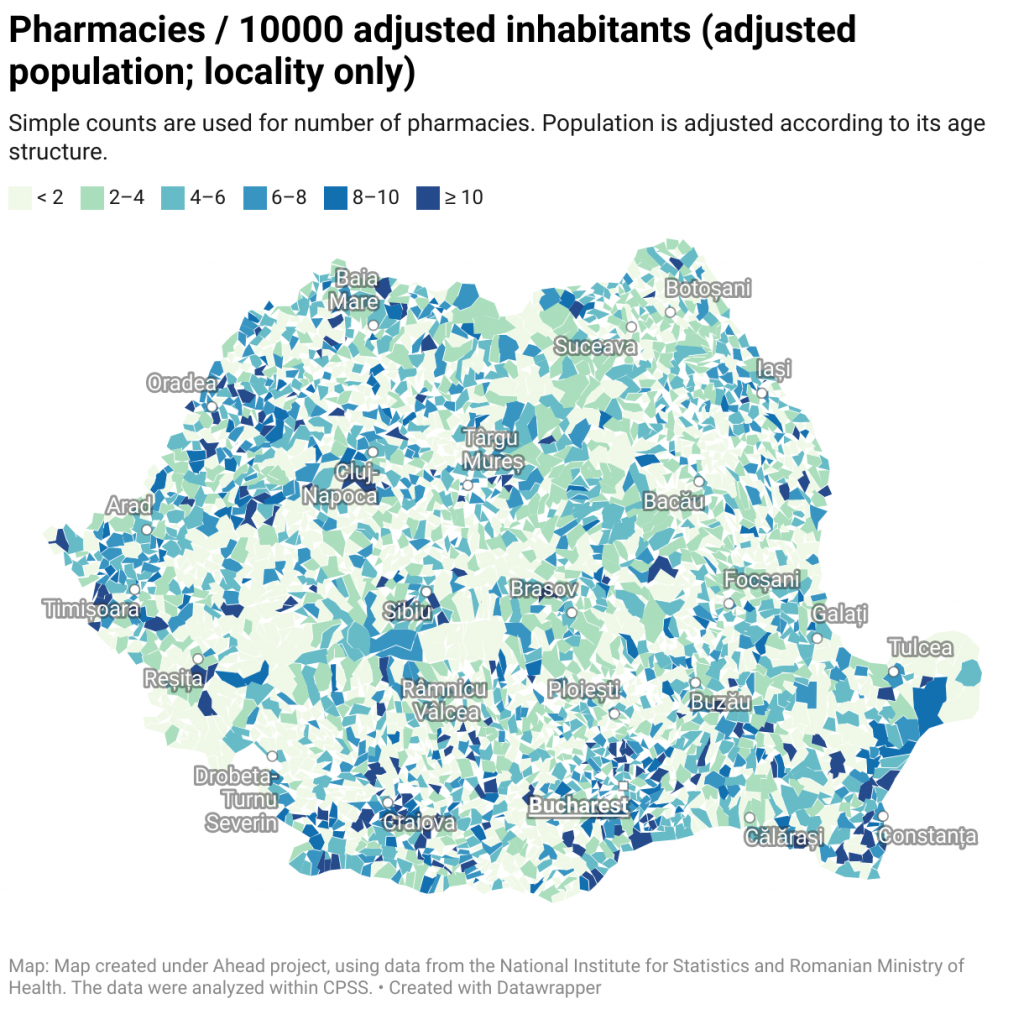
Map 5: Pharmacies / 10000 adjusted inhabitants (adjusted population; locality only)
Simple counts are used for number of pharmacies. Population is adjusted according to its age structure.
This is a map of Romania showing the number of pharmacies per municipality, and per 10.000 adjusted inhabitants.
For more information click on the MAP
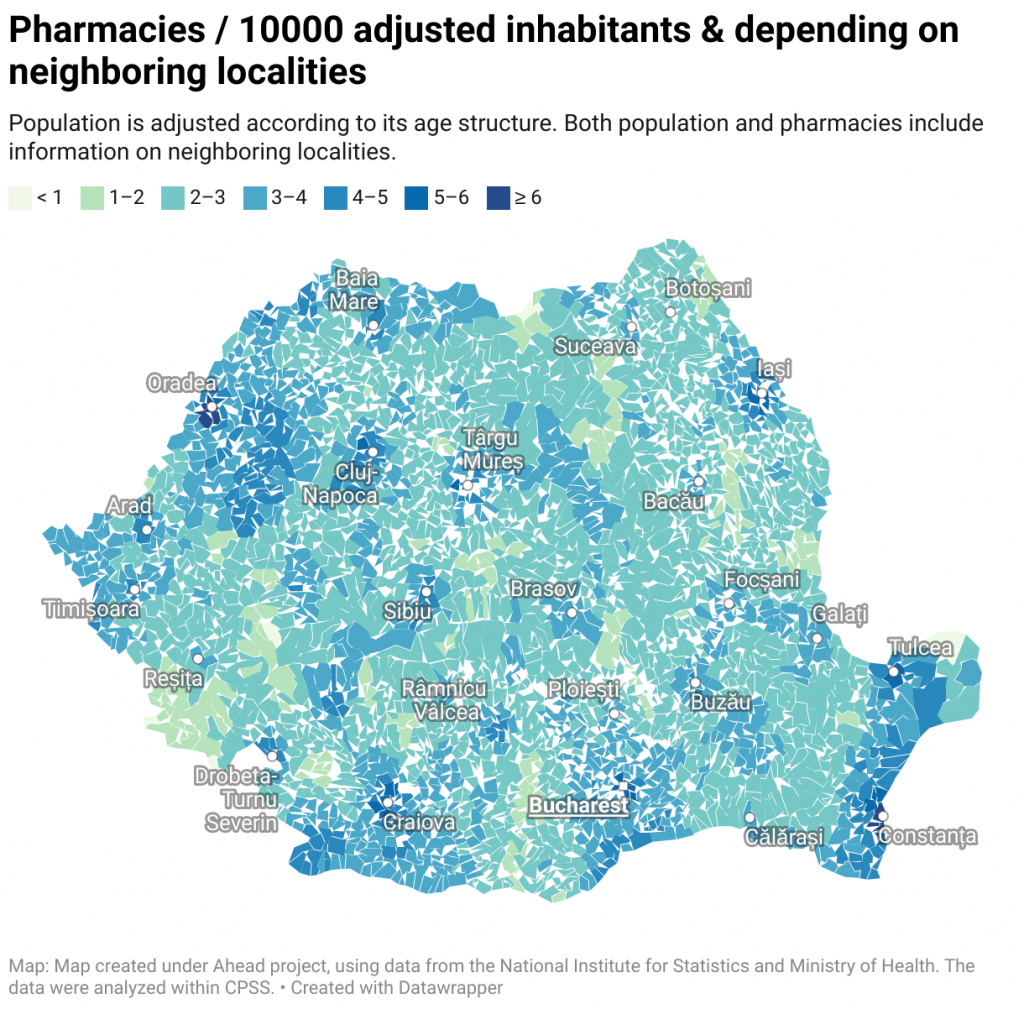 Map 6: Pharmacies / 10000 adjusted inhabitants & depending on neighboring localities
The index is taking into consideration only the unadjusted population of the locality and the number of pharmacies from that locality.
Localities are colour-coded from light blue (lowest numbers) to dark blue (highest numbers).
For more information click on the MAP
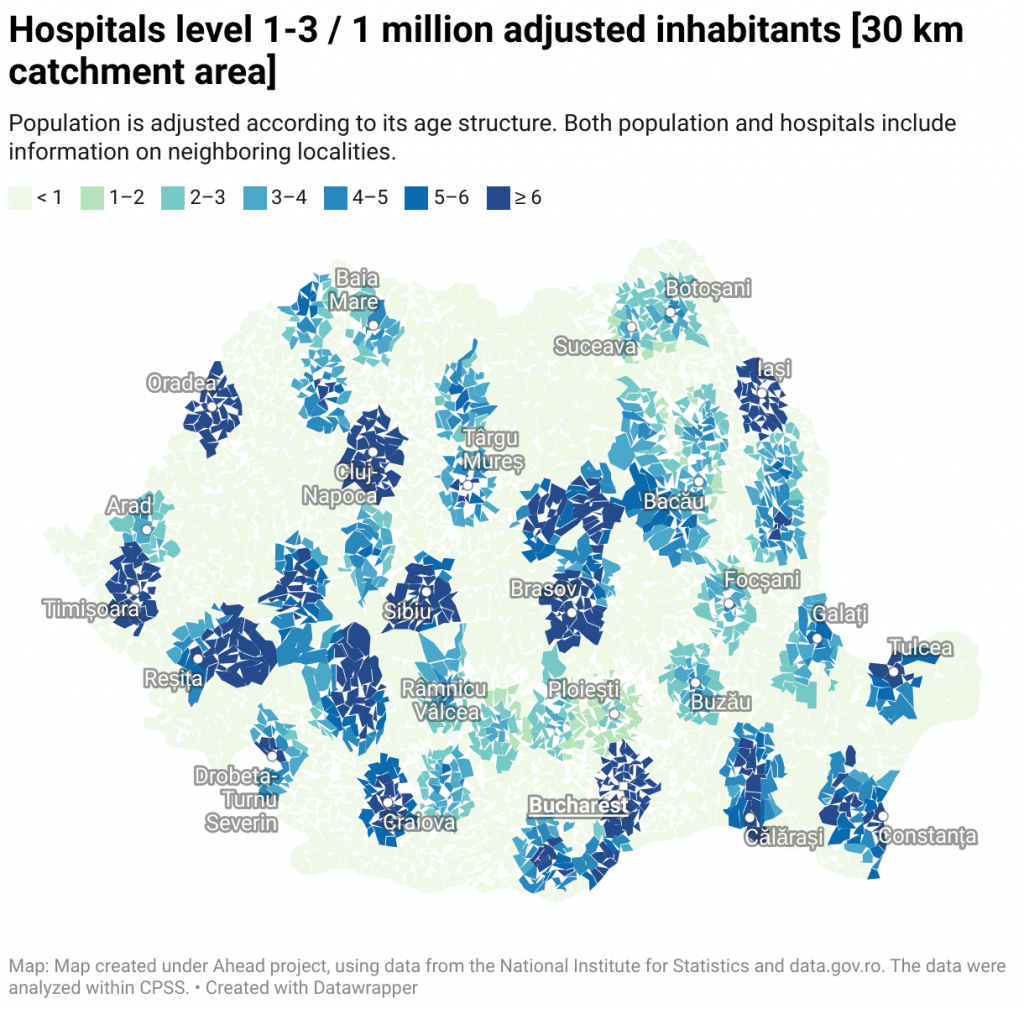
Map 7: Hospitals level 1-3 / 1 million adjusted inhabitants [30 km catchment area]
Population is adjusted according to its age structure. Both population and hospitals include information on neighboring localities.
This is a map of Romania showing the number of level 1-3 hospitals per municipality, and per 1 million adjusted inhabitants, and also considering the supply and demand within 30 km catchment area
For more information click on the MAP
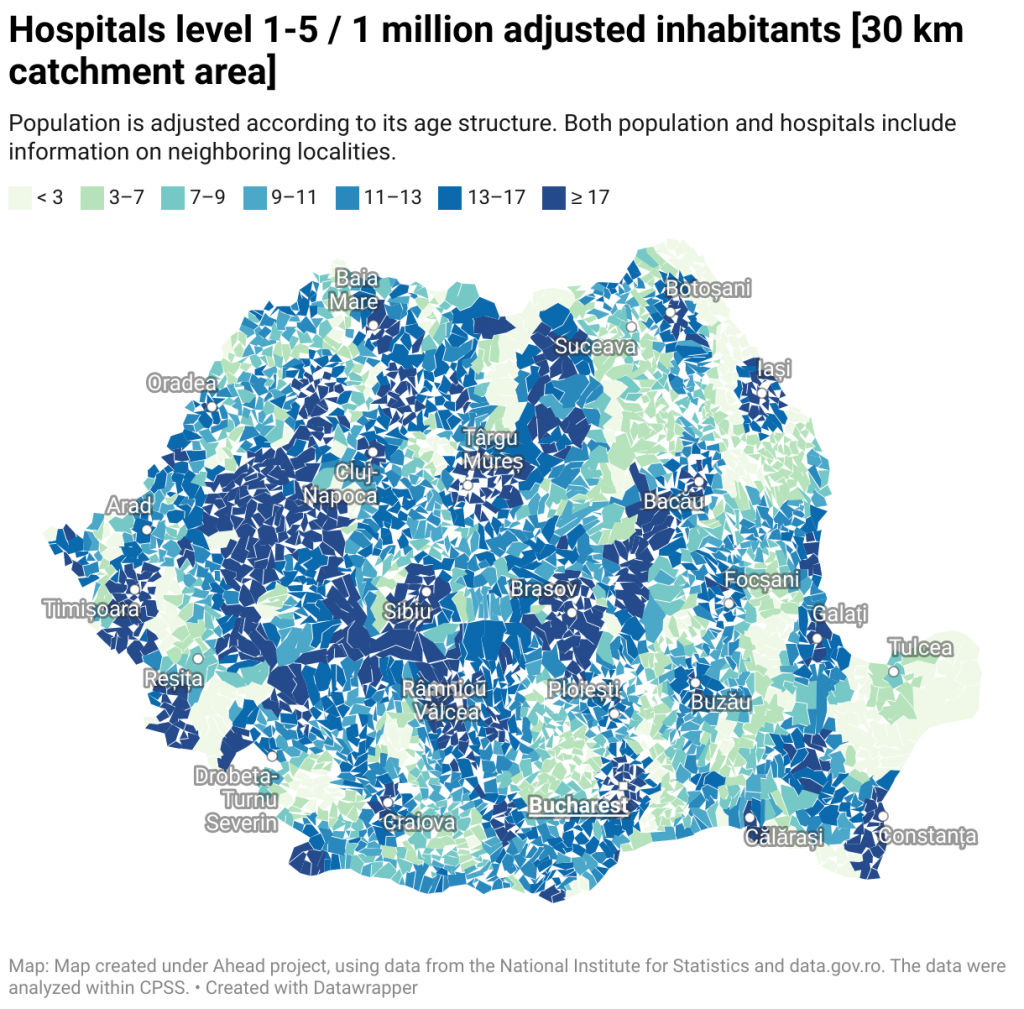
Map 8: Hospitals level 1-5 / 1 million adjusted inhabitants [30 km catchment area]
Population is adjusted according to its age structure. Both population and hospitals include information on neighboring localities.
This is a map of Romania showing the number of level 1-5 hospitals per municipality, and per 1 million adjusted inhabitants, and also considering the supply and demand within 30 km catchment area
For more information click on the MAP