On this page, you can the following information about medical desertification in the Netherlands:
1) An illustrative story about an individual affected by medical desertification in the Netherlands
2) Our country report on medical deserts in the Netherlands
3) A selection of indicators for background information about the Netherlands
4) Our Medical Deserts Diagnostic Tool: maps based on the contextualised set of indicators
This is a map of the Netherlands showing the full-time equivalent of GPs per 100,000 population per municipality. Colour-coded from lightest blue (less than 30) to darkest blue (more than 65), for the years 2015-2018.
The municipalities are based on the 2018 municipal reorganisation. Comparing the years 2015-2018 gives an indication of the changes in GP coverage in the Netherlands.
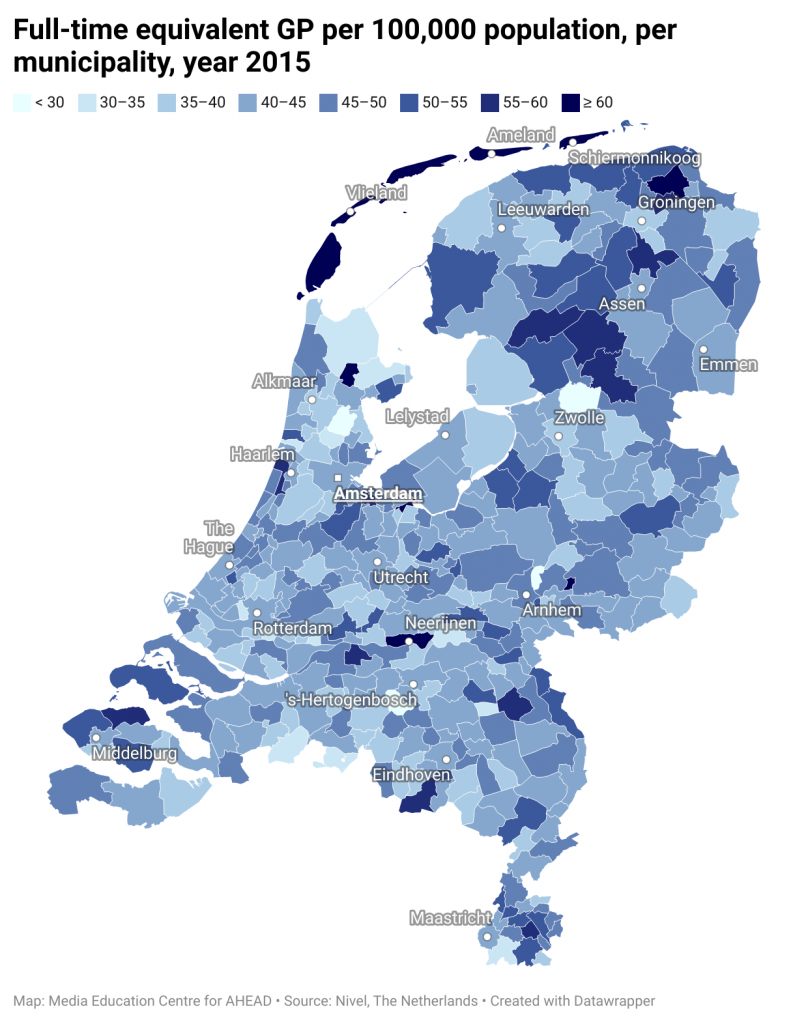
This is a map of the Netherlands showing the full-time equivalent of GPs per 100,000 population per municipality. Colour-coded from lightest blue (less than 30) to darkest blue (more than 65), for the year 2015.
The municipalities are based on the 2018 municipal reorganisation. Comparing the years 2015-2018 gives an indication of the changes in GP coverage in the Netherlands.
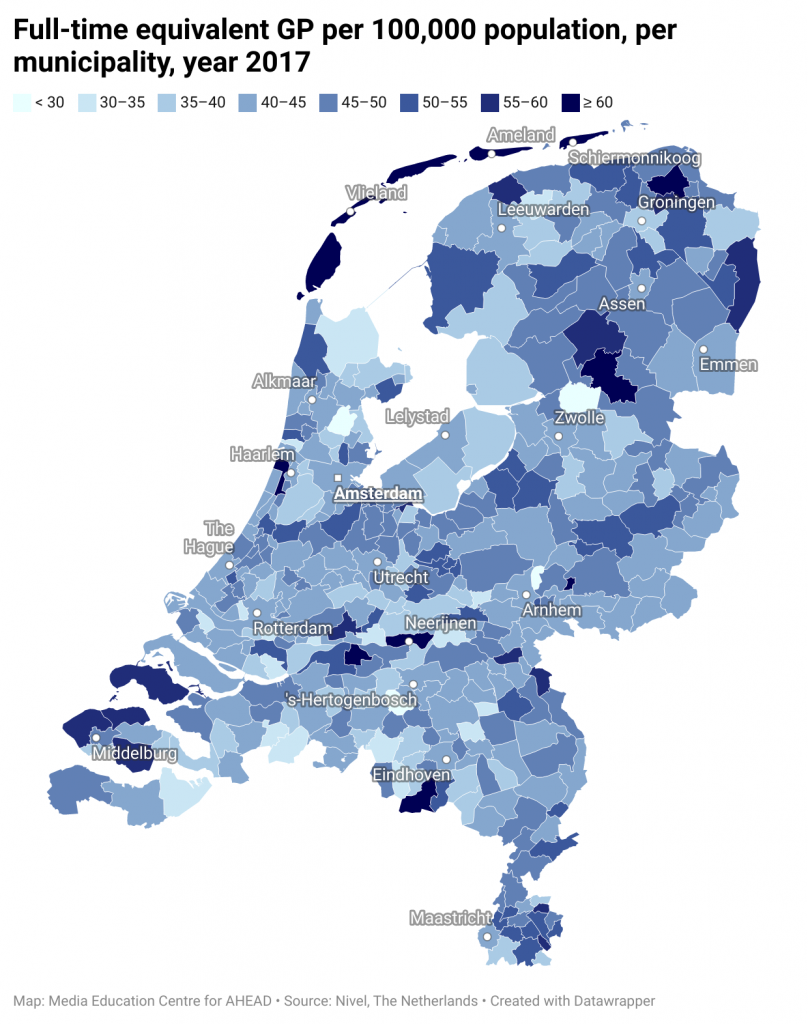
This is a map of the Netherlands showing the full-time equivalent of GPs per 100,000 population per municipality. Colour-coded from lightest blue (less than 30) to darkest blue (more than 65), for the year 2017.
The municipalities are based on the 2018 municipal reorganisation. Comparing the years 2015-2018 gives an indication of the changes in GP coverage in the Netherlands.
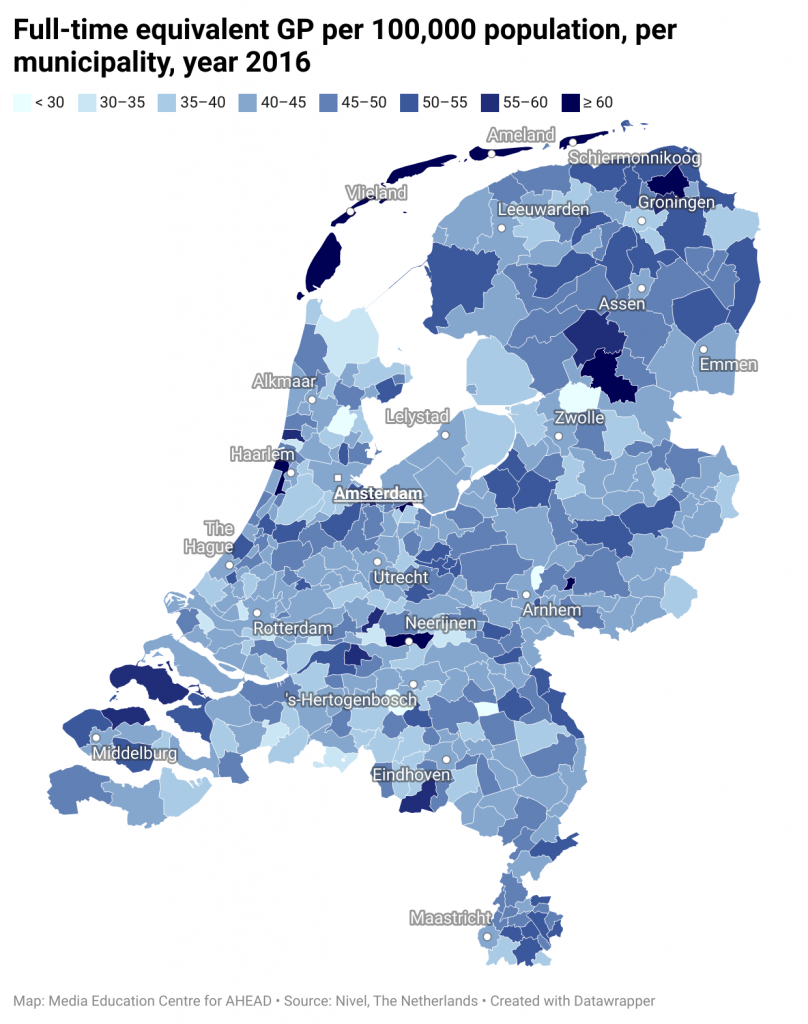
This is a map of the Netherlands showing the full-time equivalent of GPs per 100,000 population per municipality. Colour-coded from lightest blue (less than 30) to darkest blue (more than 65), for the year 2016.
The municipalities are based on the 2018 municipal reorganisation. Comparing the years 2015-2018 gives an indication of the changes in GP coverage in the Netherlands.
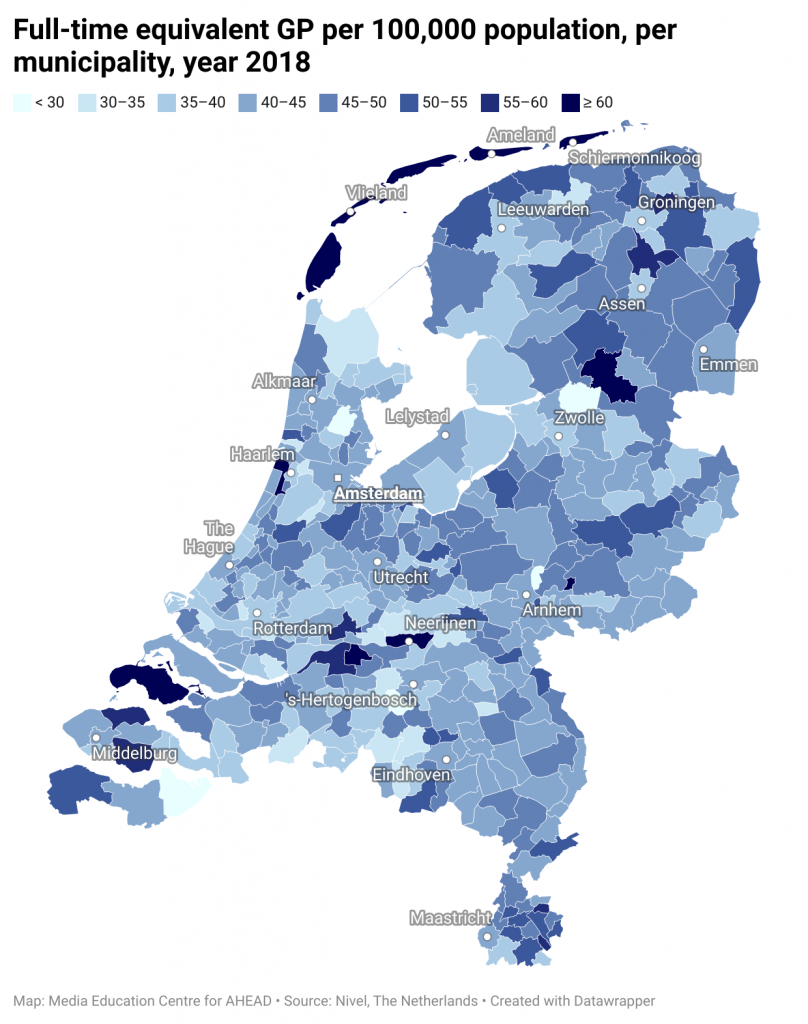
This is a map of the Netherlands showing the full-time equivalent of GPs per 100,000 population per municipality. Colour-coded from lightest blue (less than 30) to darkest blue (more than 65), for the year 2018.
The municipalities are based on the 2018 municipal reorganisation. Comparing the years 2015-2018 gives an indication of the changes in GP coverage in the Netherlands.
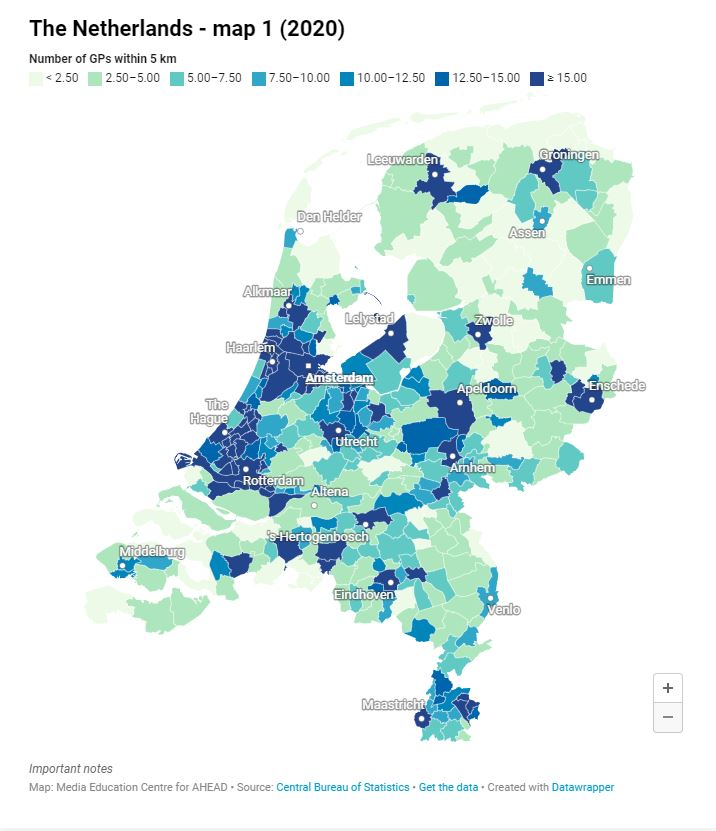
This is a map of the Netherlands showing the number of general practitioners (GP) practice locations available within 5 km, per municipality, as a possible indicator of healthcare access, colour-coded from light blue (lowest numbers) to dark blue (highest numbers). A clear rural-urban gradient can be observed.
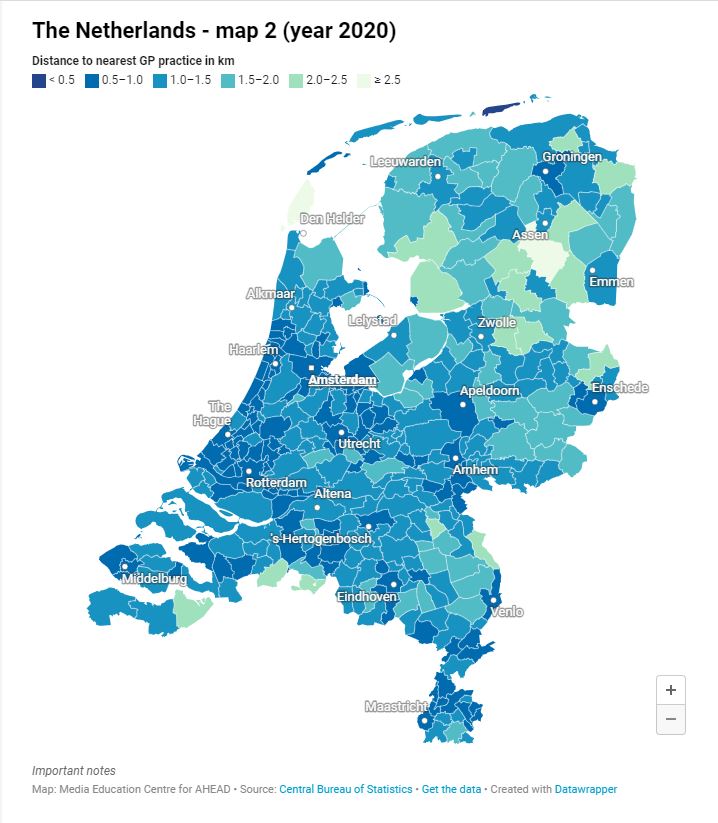
This is a map of the Netherlands showing the distance, in km, to the nearest general practitioners (GP) practice, per municipality, as a possible indicator of healthcare access, colour-coded from light blue (longest distance) to dark blue (shortest distance). A clear rural-urban gradient can be observed, but not as pronounced as in map 1.
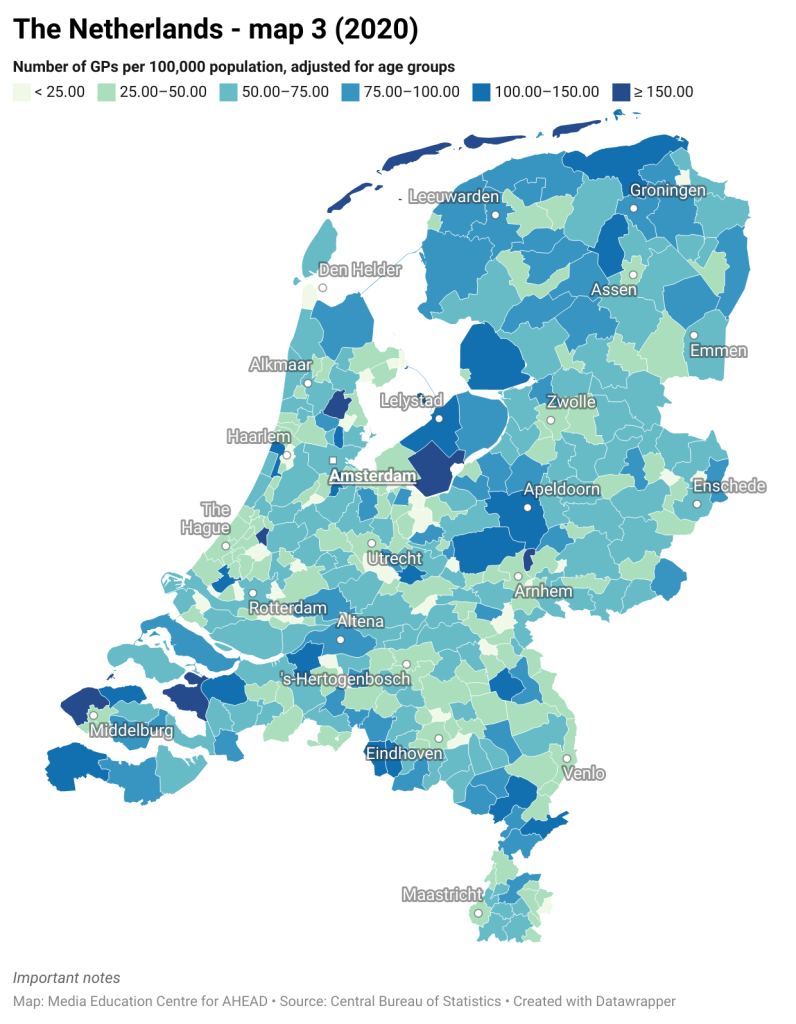
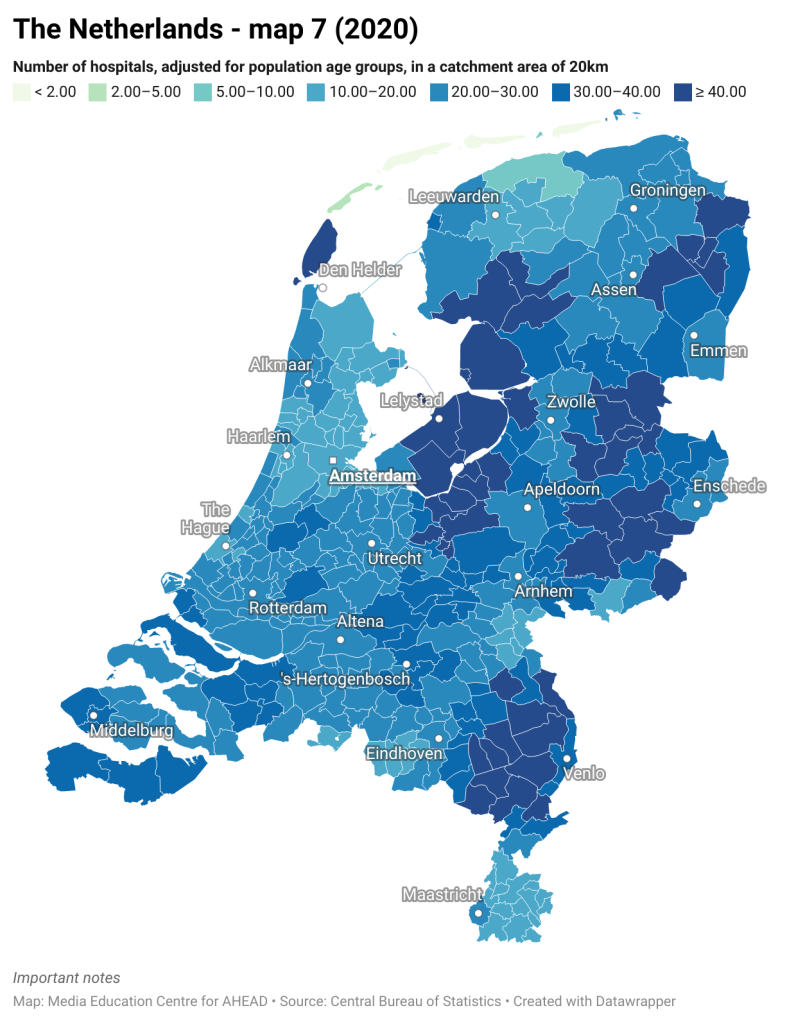
This is a map of the Netherlands showing the number of GPs per 100,000 per municipality, adjusted for the population size and age groups. Different age groups require different levels of health care; this is accounted for in this map. Colour-coded from light blue (less GPs per 100,000 per municipality, adjusted for the population size and age groups) to dark blue (more GPs per 100,000 per municipality, adjusted for the population size and age groups).
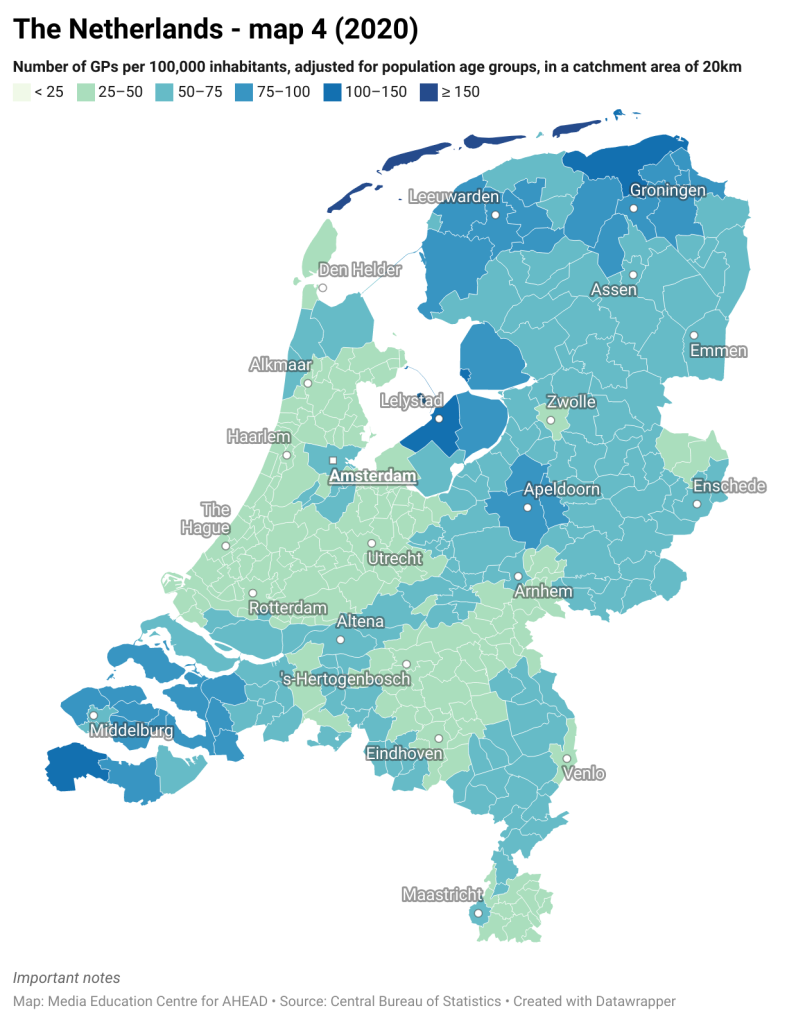
This is a map of the Netherlands showing the number of GPs per 100,000 (per municipality), adjusted for the population size and age groups, and taking into consideration a service area (catchment area) with a radius of 20 km. Different age groups require different levels of health care; this is accounted for in this map. Moreover, a 10 km distance to a GP practice could be considered an acceptable distance, which means that people living within that area can choose which GP to visit. Colour-coded from light blue (less GPs per 100,000 per municipality, adjusted for the population size and age groups, within 20km) to dark blue (more GPs per 100,000 per municipality, adjusted for the population size and age groups, within 20 km).
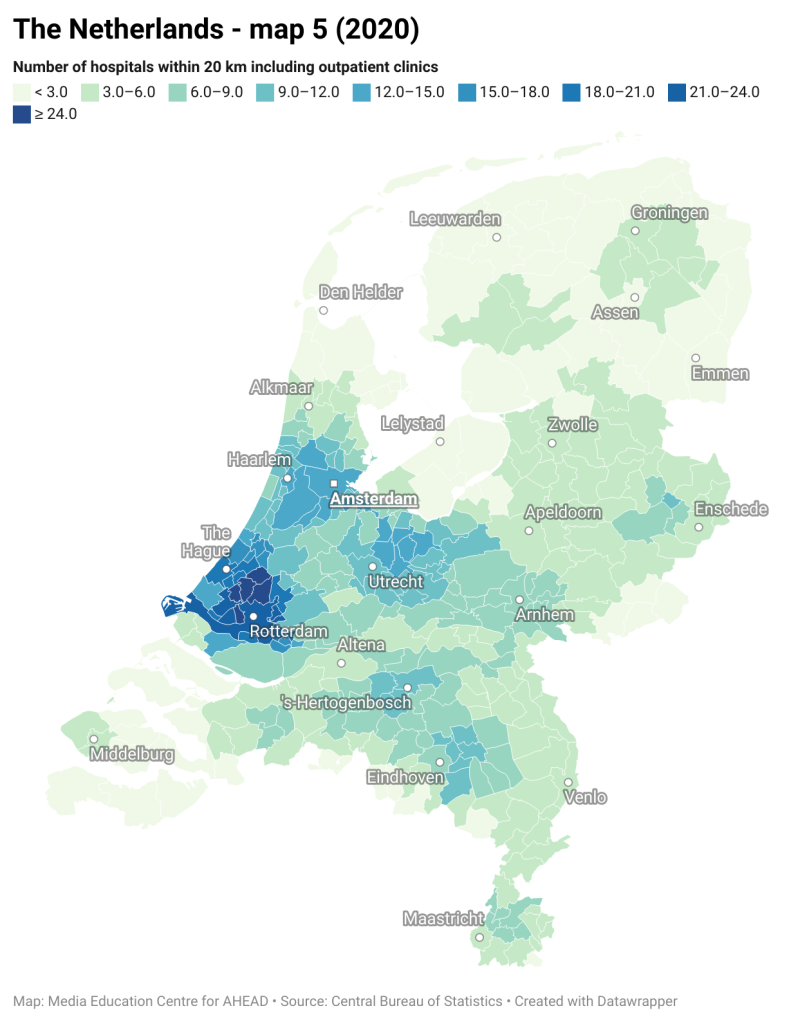
This is a map of the Netherlands showing the number of hospitals (including outpatient clinics) within a distance of 20 km. Colour-coded from light blue (less than 3) to dark blue (more than 24).
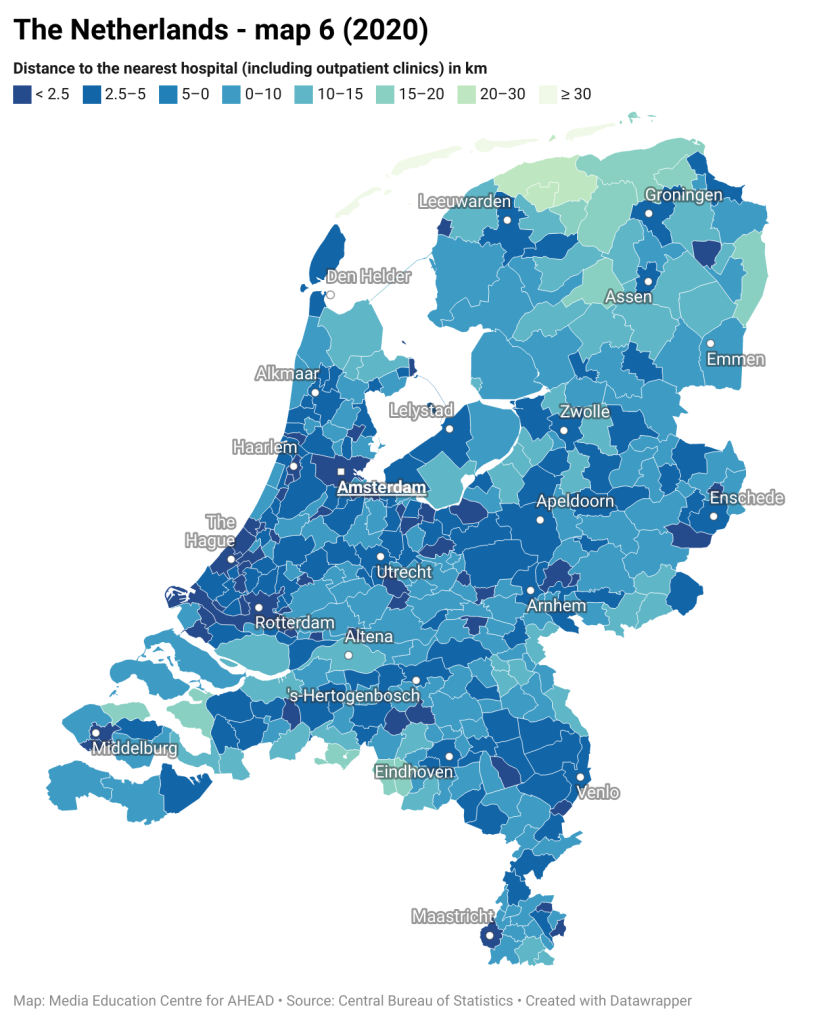
This is a map of the Netherlands showing the distance to the nearest hospital (including outpatient clinics). Colour-coded from light blue (more than 30 km) to dark blue (less than 2,5 km)