On this page, you can the following information about medical desertification in Serbia:
1) An illustrative story about an individual affected by medical desertification in Serbia
2) Our country report on medical deserts in Serbia
3) A selection of indicators for background information about Serbia
4) Our Medical Deserts Diagnostic Tool: maps based on the contextualised set of indicator
This diagram show number of patients per general practitioner (yellow), gynecologist (red), and pedestrian (blue) in Serbian districts in 2020.
For more details please click on the LINK!
Below, you can see separate maps showing the numbers of patients per general practitioner (yellow), gynecologist (red), and pedestrian (blue) in Serbian districts in 2020.
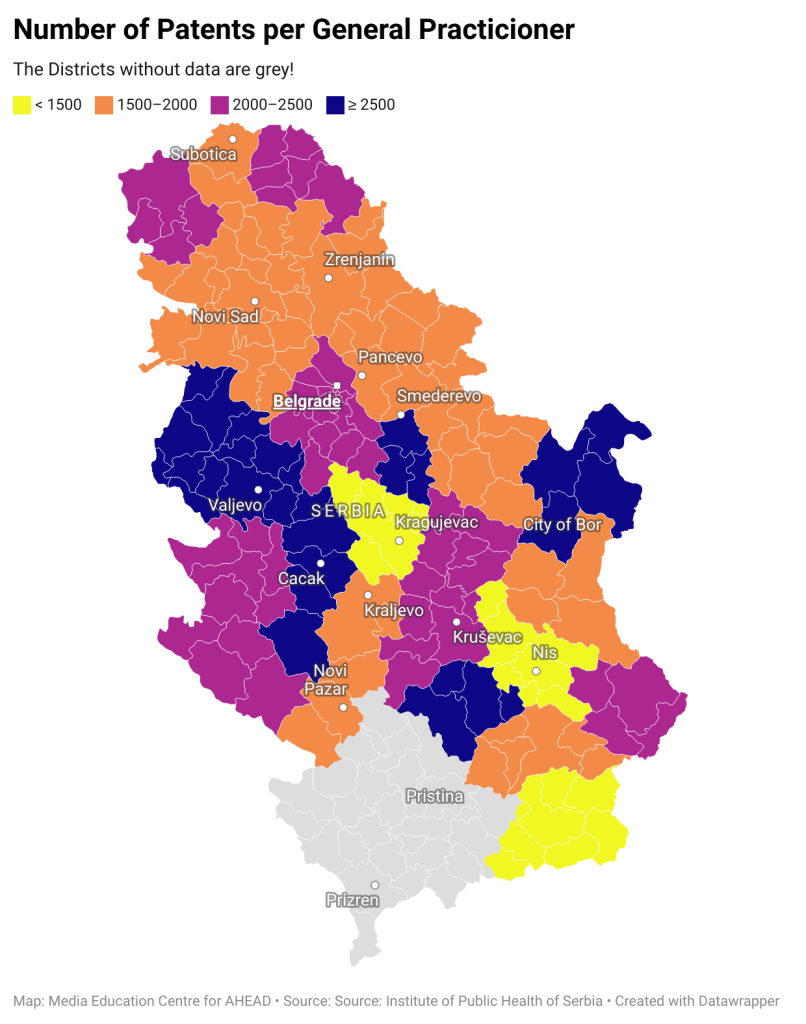
This is a map of Serbia by districts (LAU1 level) showing the total number of patients per general practitioner per population over 20 years old in 2020.
Colour-coded from yellow (from less than 1500) to dark blue (to over 2500).
For more information click on the MAP!
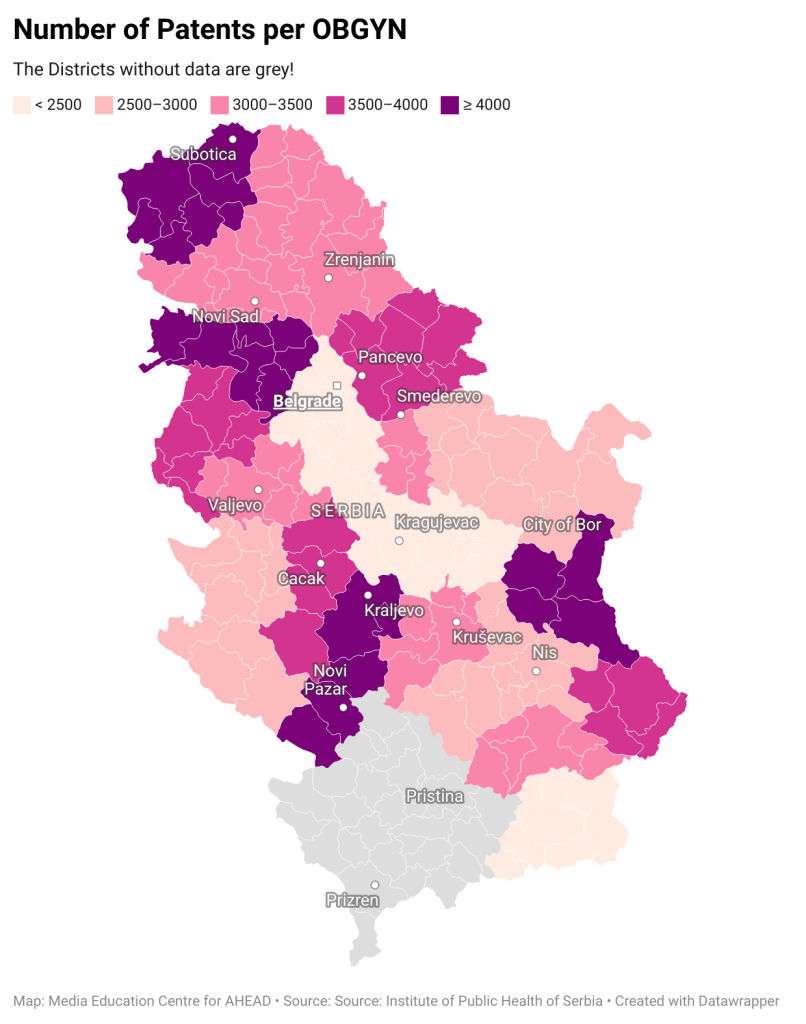
This is a map of Serbia by districts (LAU1 level) showing the total number of patients per OBGYN per female population over 16 years old in 2020.
Colour-coded from light (from less than 2500) to dark (to over 4000).
For more information click on the MAP!
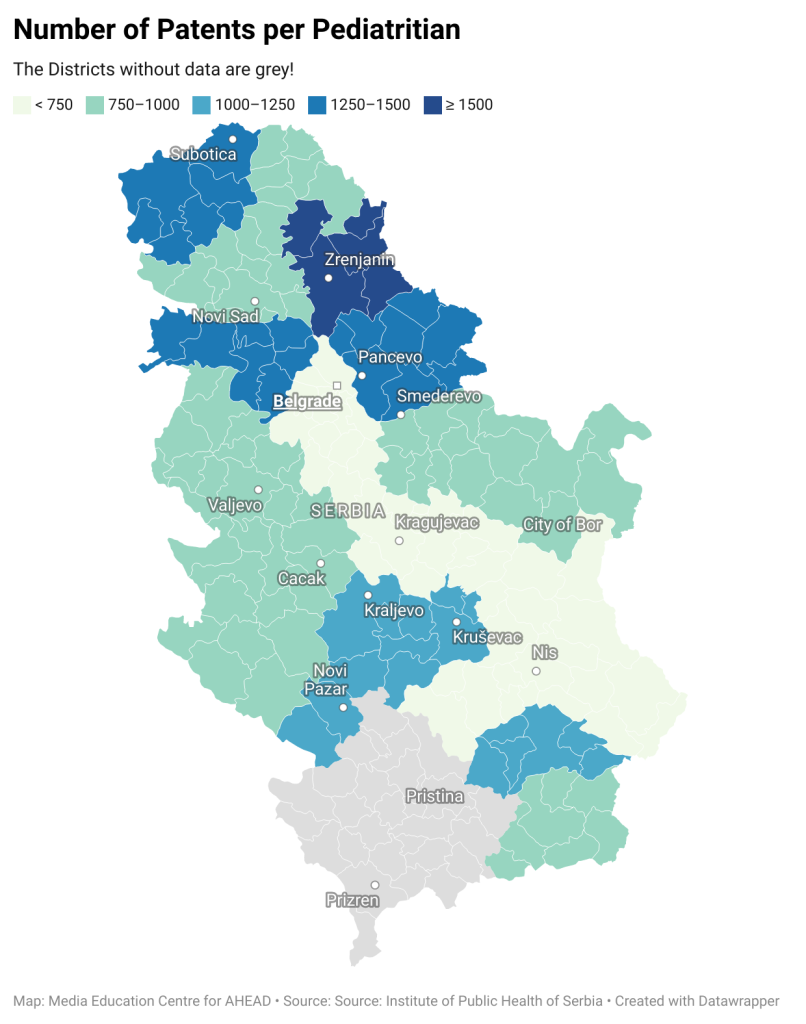
This is a map of Serbia by municipalities (LAU1 level) showing the total number of patients per Pediatrian per population less than 15 years old in 2020.
Colour-coded from light yellow (from less than 750) to dark blue (to over 1500).
For more information click on the MAP!
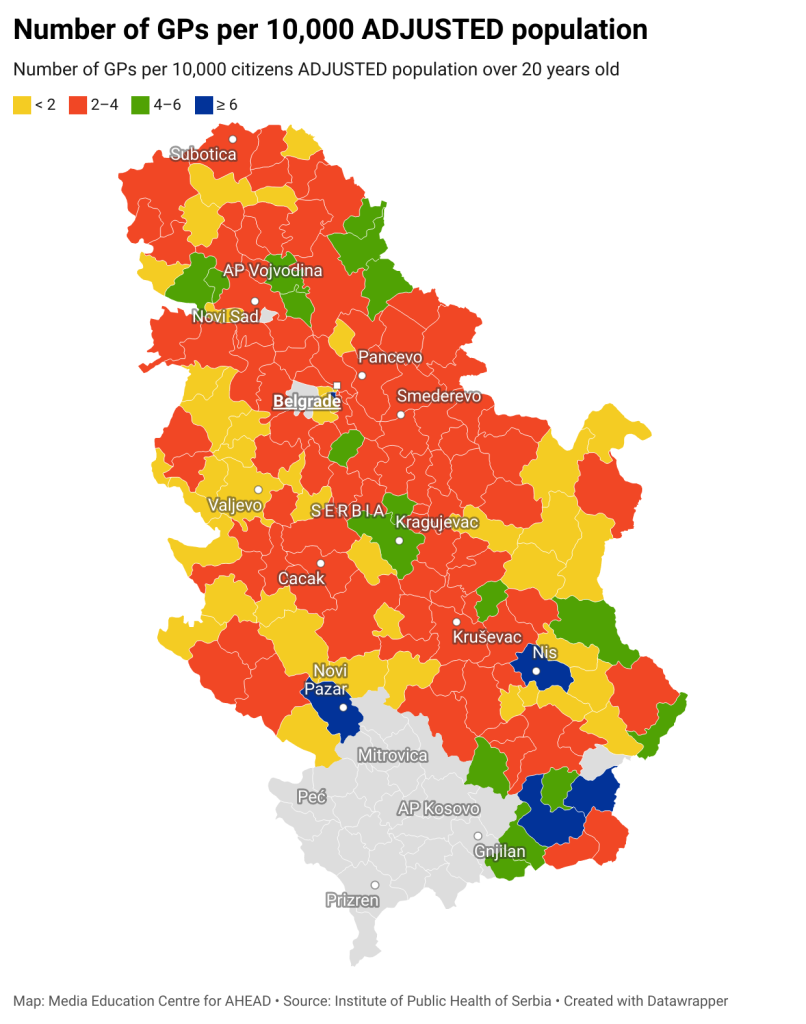
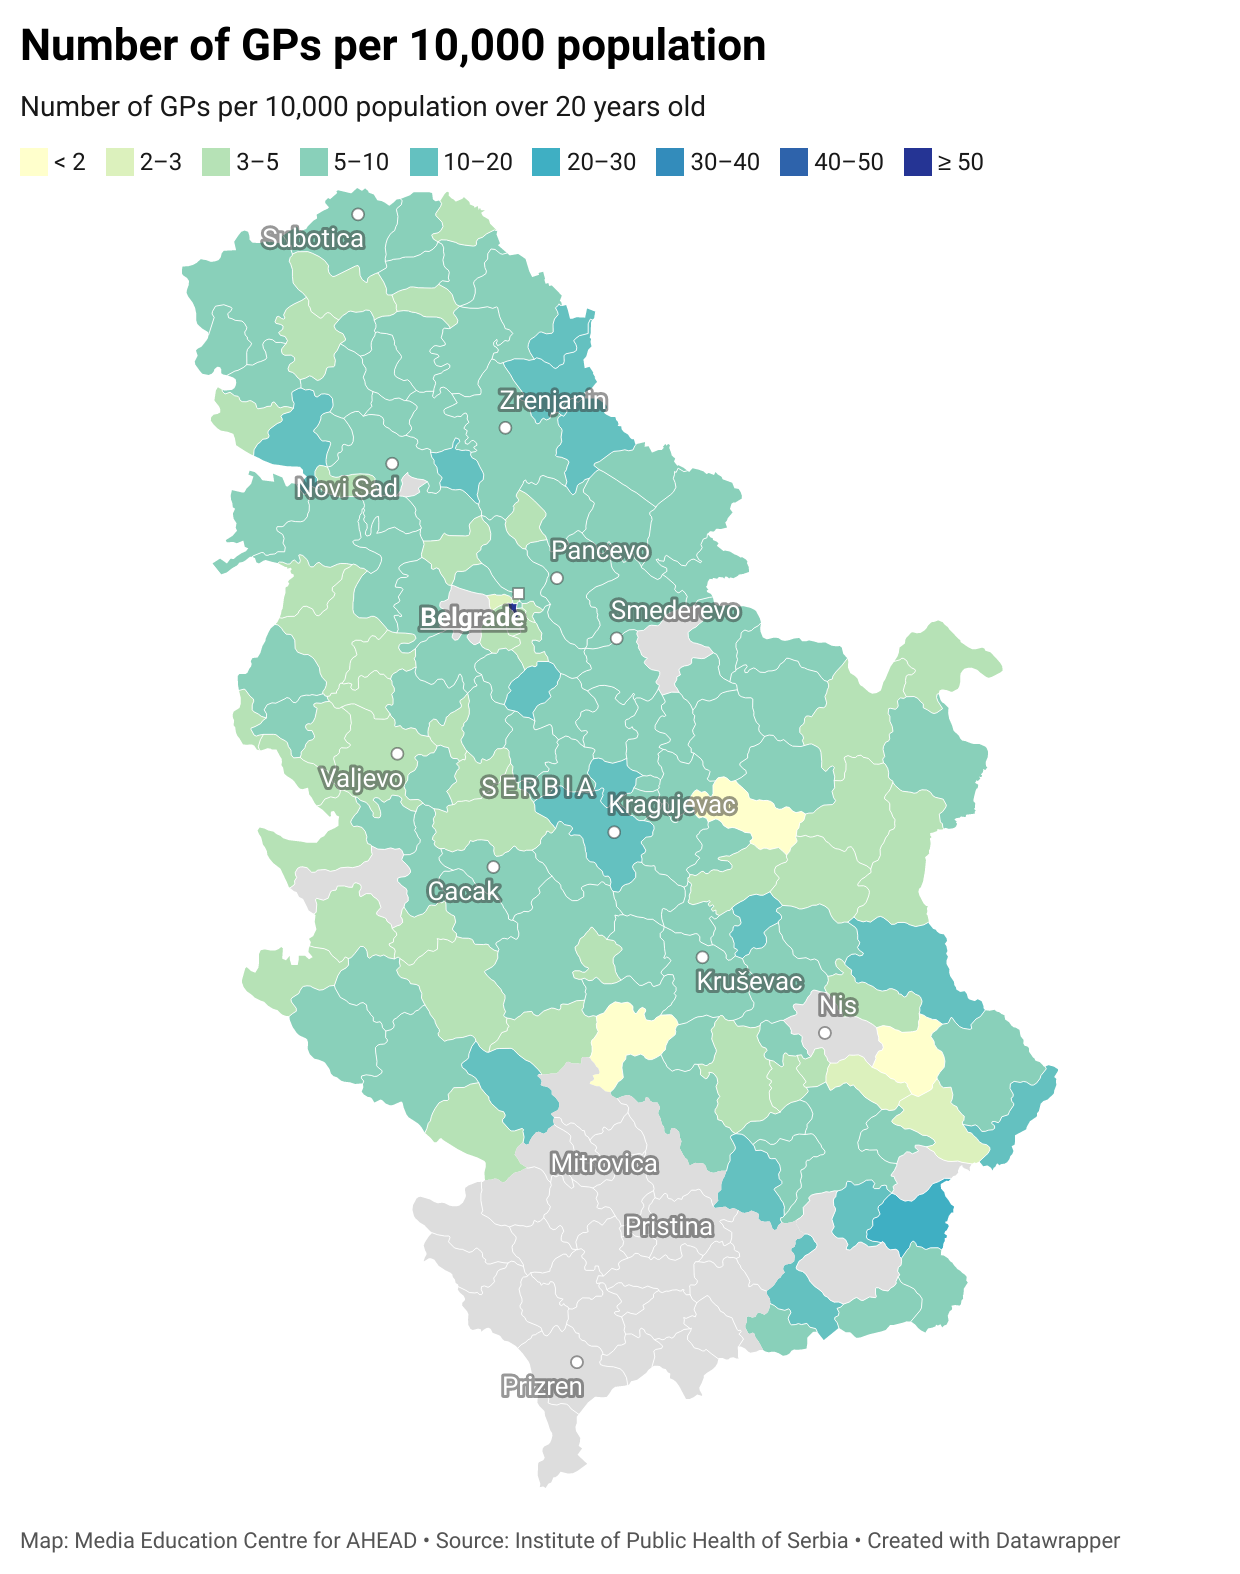
Number of GPs per 10,000 citizens ADJUSTED population over 20 years old
This is a map of Serbia by municipalities (LAU1 level) showing the total number of general practitioners per 10,000 ADJUSTED population over 20 years old in 2020, colour coded from yellow (from less than 2) to dark blue (to over 6).
For more information click on the MAP!
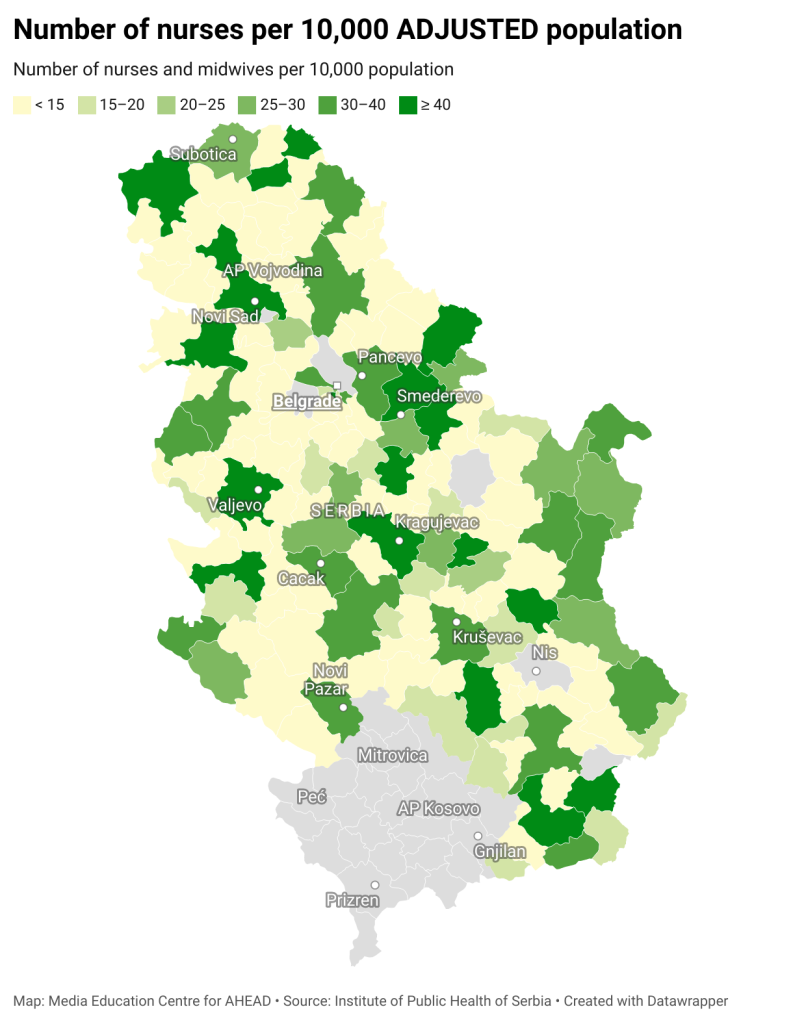
Number of Nurses per 10,000 population
This is a map of Serbia by municipalities (LAU1 level) showing the total number of Nurses per 10,000 population over 20 years old in 2020, colour coded from light yellow (from less than 15) to dark green (to over 40).
For more information click on the MAP!
Map 1: Total number of General Practitioners per 10,000 population
This is a map of Serbia by municipalities (LAU1 level) showing the total number of general practitioners per 10,000 population over 20 years old in 2020, colour coded from light yellow (from less than 5) to dark green (to over 87).
For more information click on the MAP!
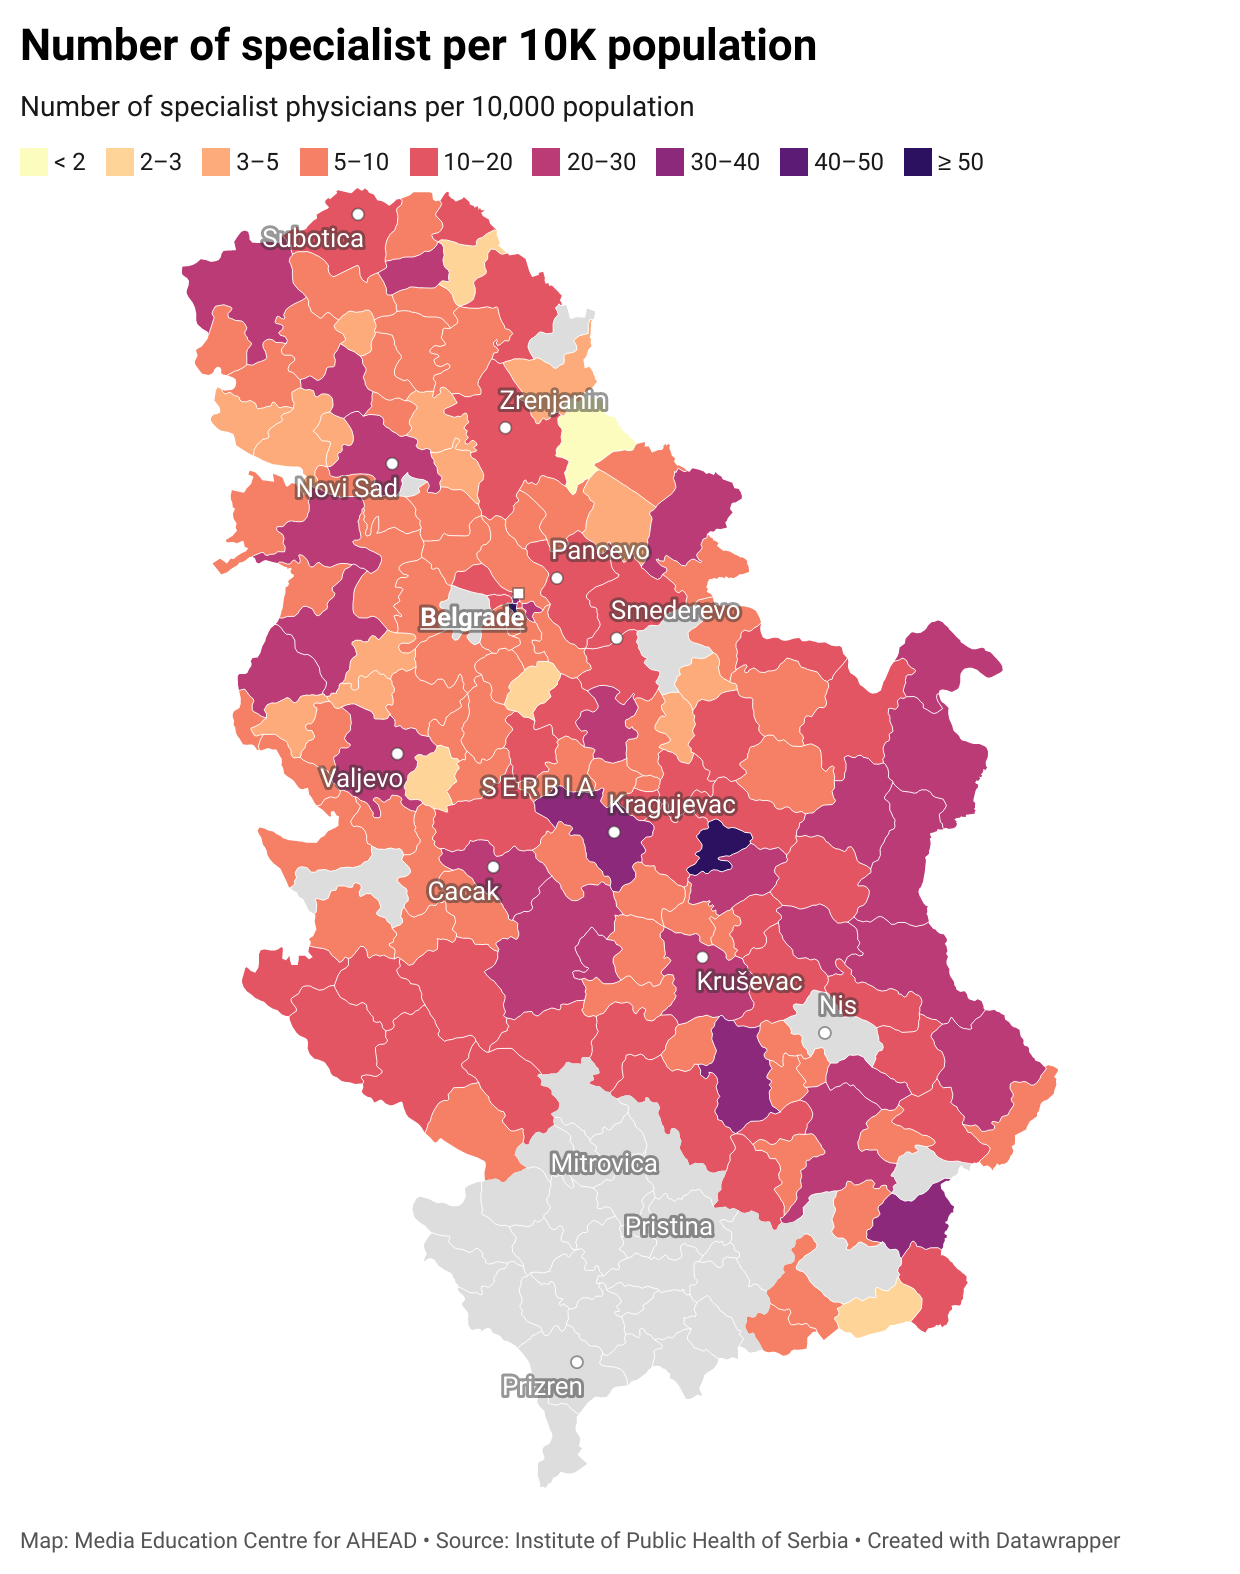
Map 2: Total number of specialists per 10,000 population
This is a map of Serbia by municipalities (LAU1 level) showing the number of specialist physicians per 10,000 population in 2020, colour coded from light yellow (from less than 5) to dark blue (to over 70).
For more information click on the MAP!
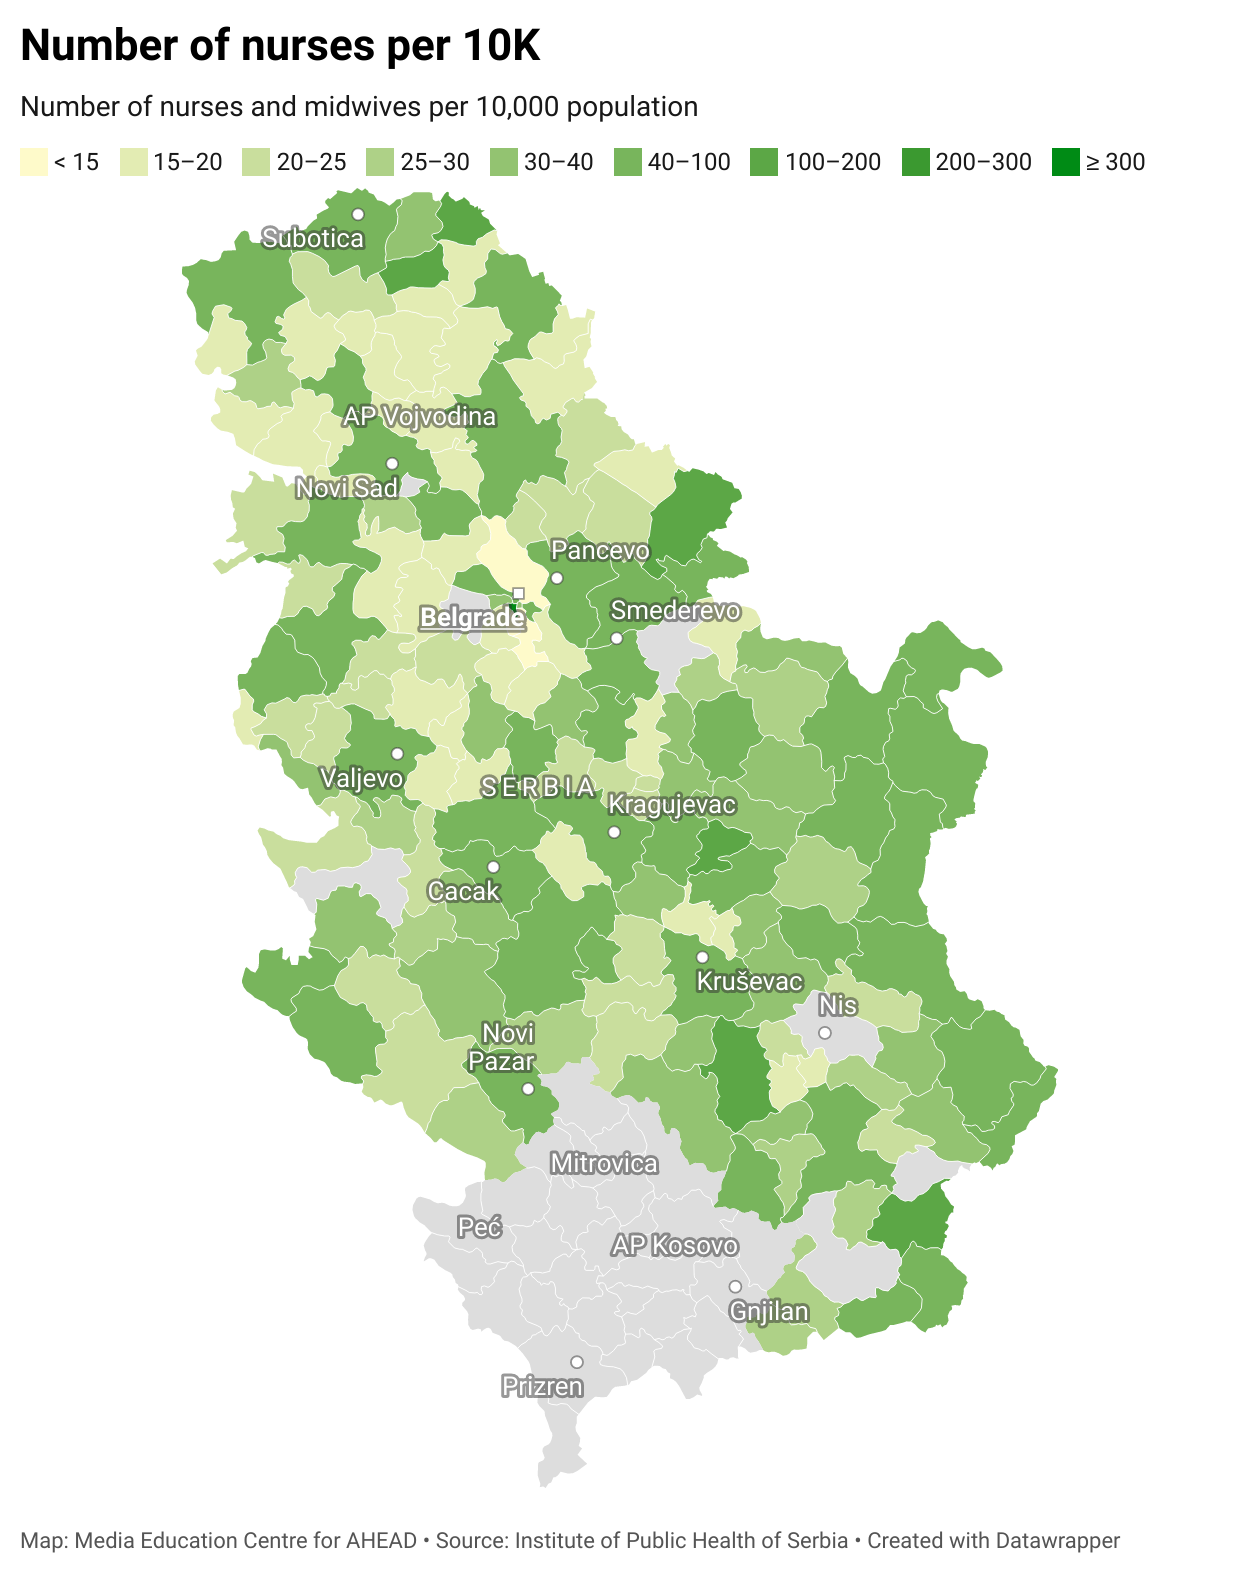
Map 3: Total number of nurses per 10,000 population
This is a map of Serbia by municipalities (LAU1 level) showing the total number of nurses and midwives per 10,000 population in 2020, colour coded from light yellow (from less than 25) to dark blue (to over 400).
For more information click on the MAP!
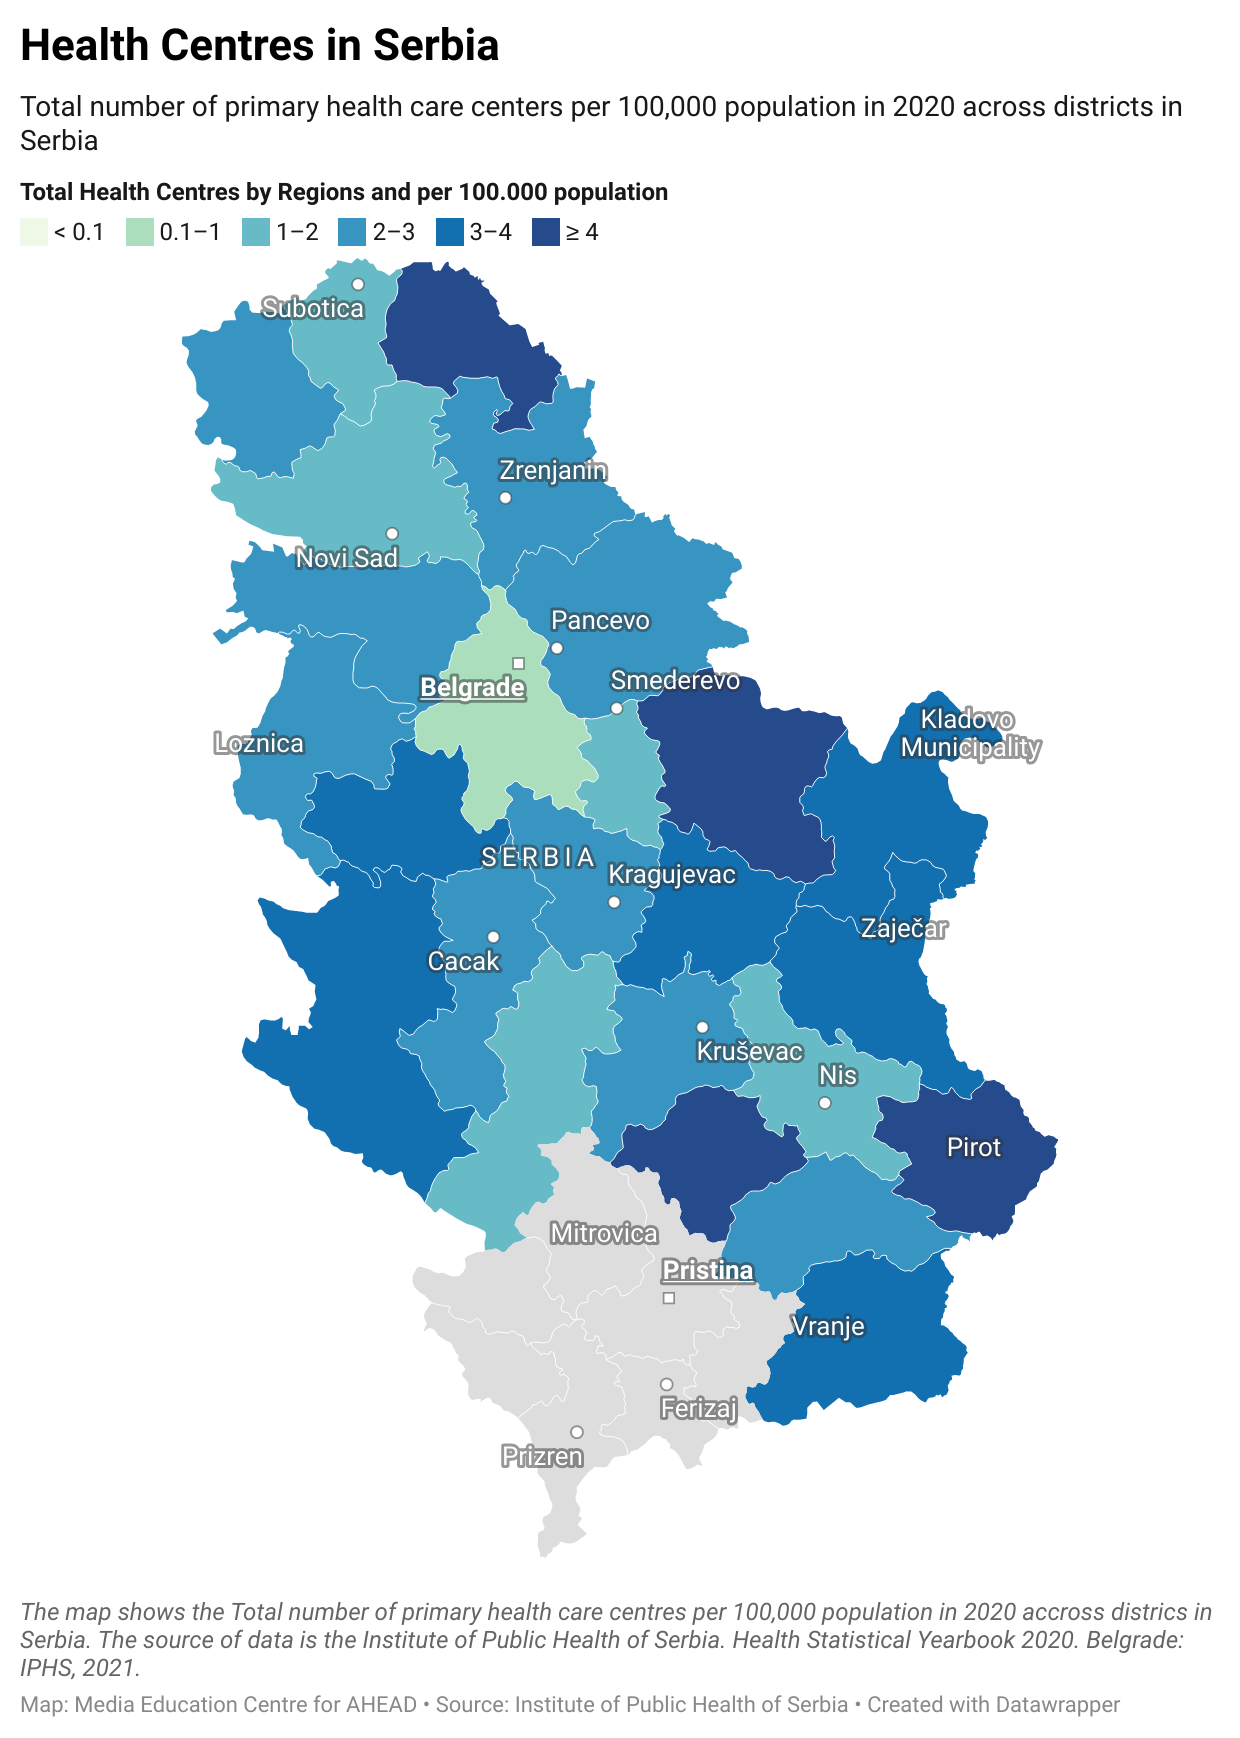
Map 4: Total health centres by districts and per 100,000 population
The map shows the total number of primary health care centers per 100,000 population in 2020 across districts in Serbia. The source of data is the Institute of Public Health of Serbia. Health Statistical Yearbook 2020. Belgrade: IPHS, 2021.
Source: Institute of Public Health of Serbia. Health Statistical Yearbook 2020. Belgrade: IPHS, 2021
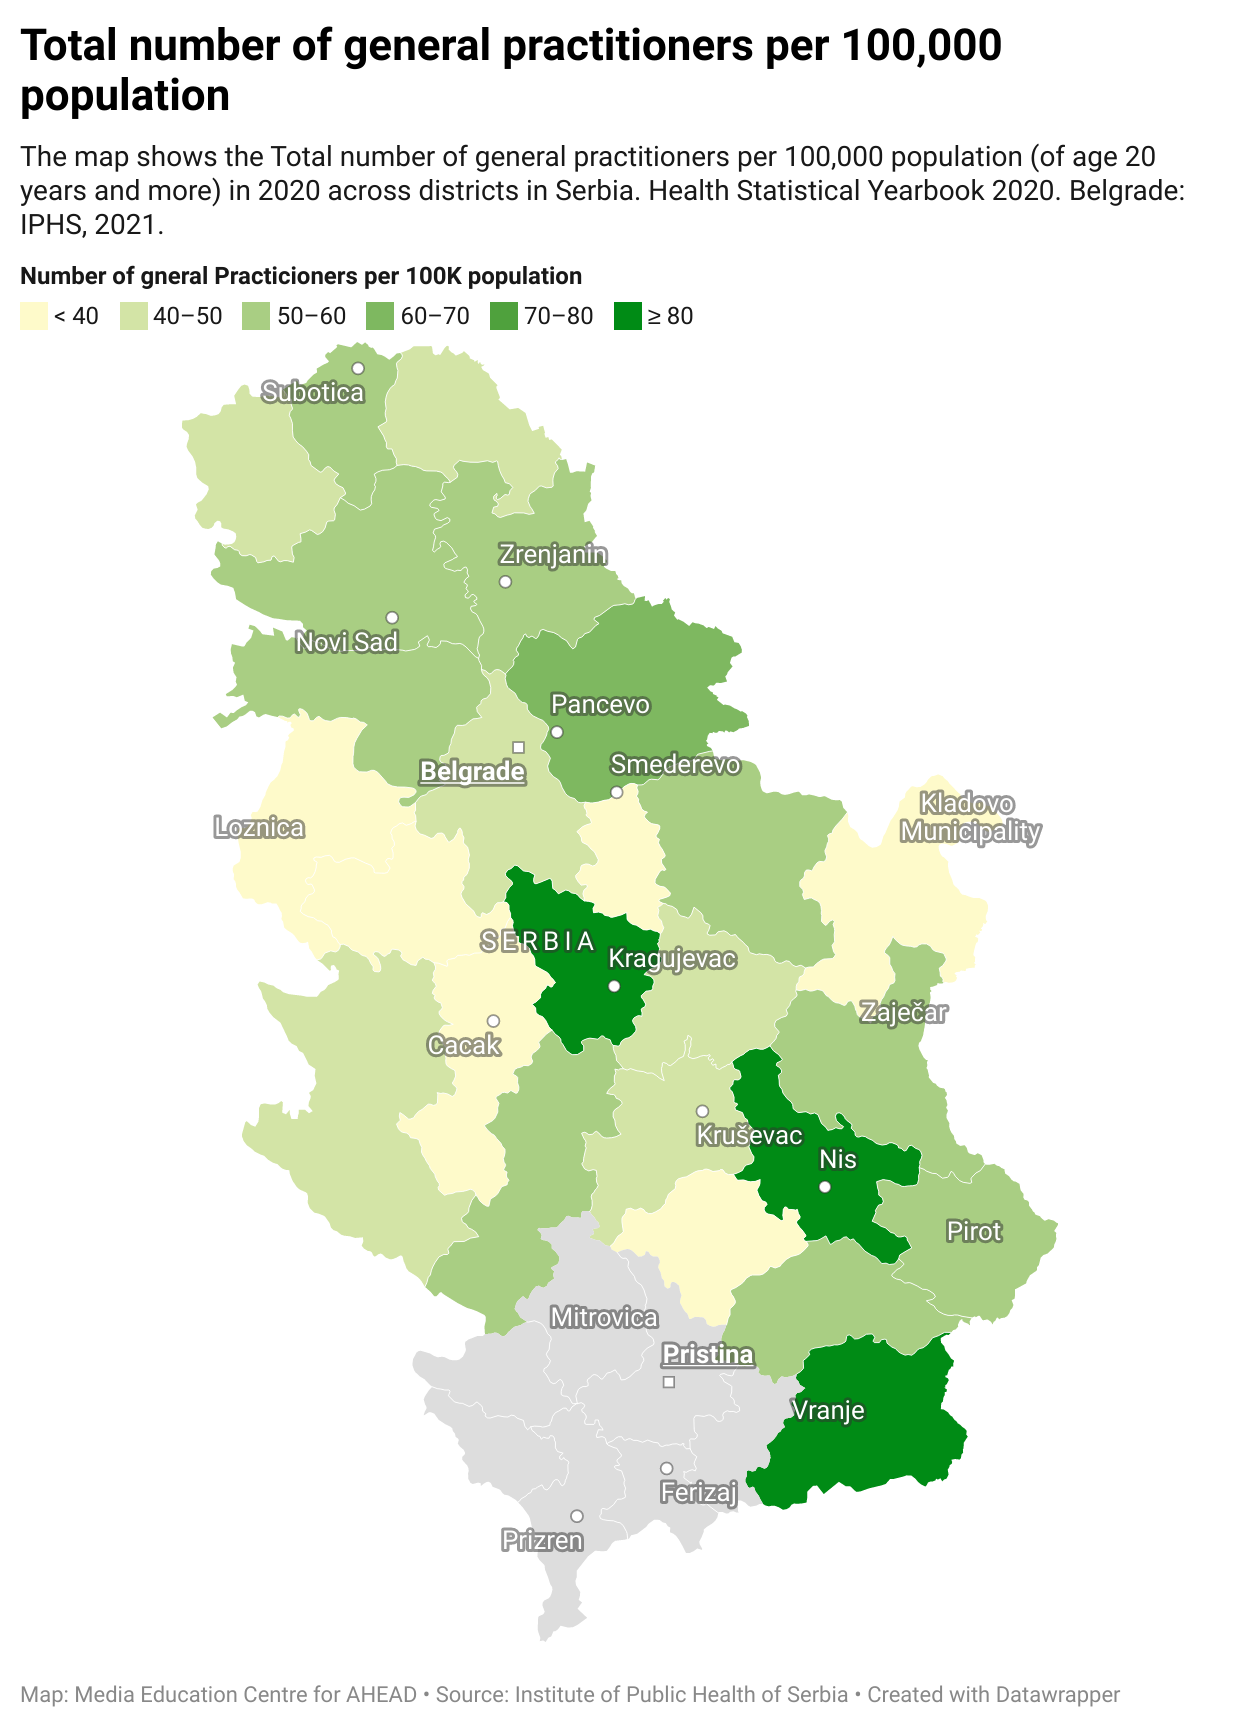
Map 5: Total number of general practitioners per 100,000 population
The map shows the Total number of general practitioners per 100,000 population (of age 20 years and more) in 2020 accross districs in Serbia.
The source of data is the Institute of Public Health of Serbia. Health Statistical Yearbook 2020. Belgrade: IPHS, 2021.
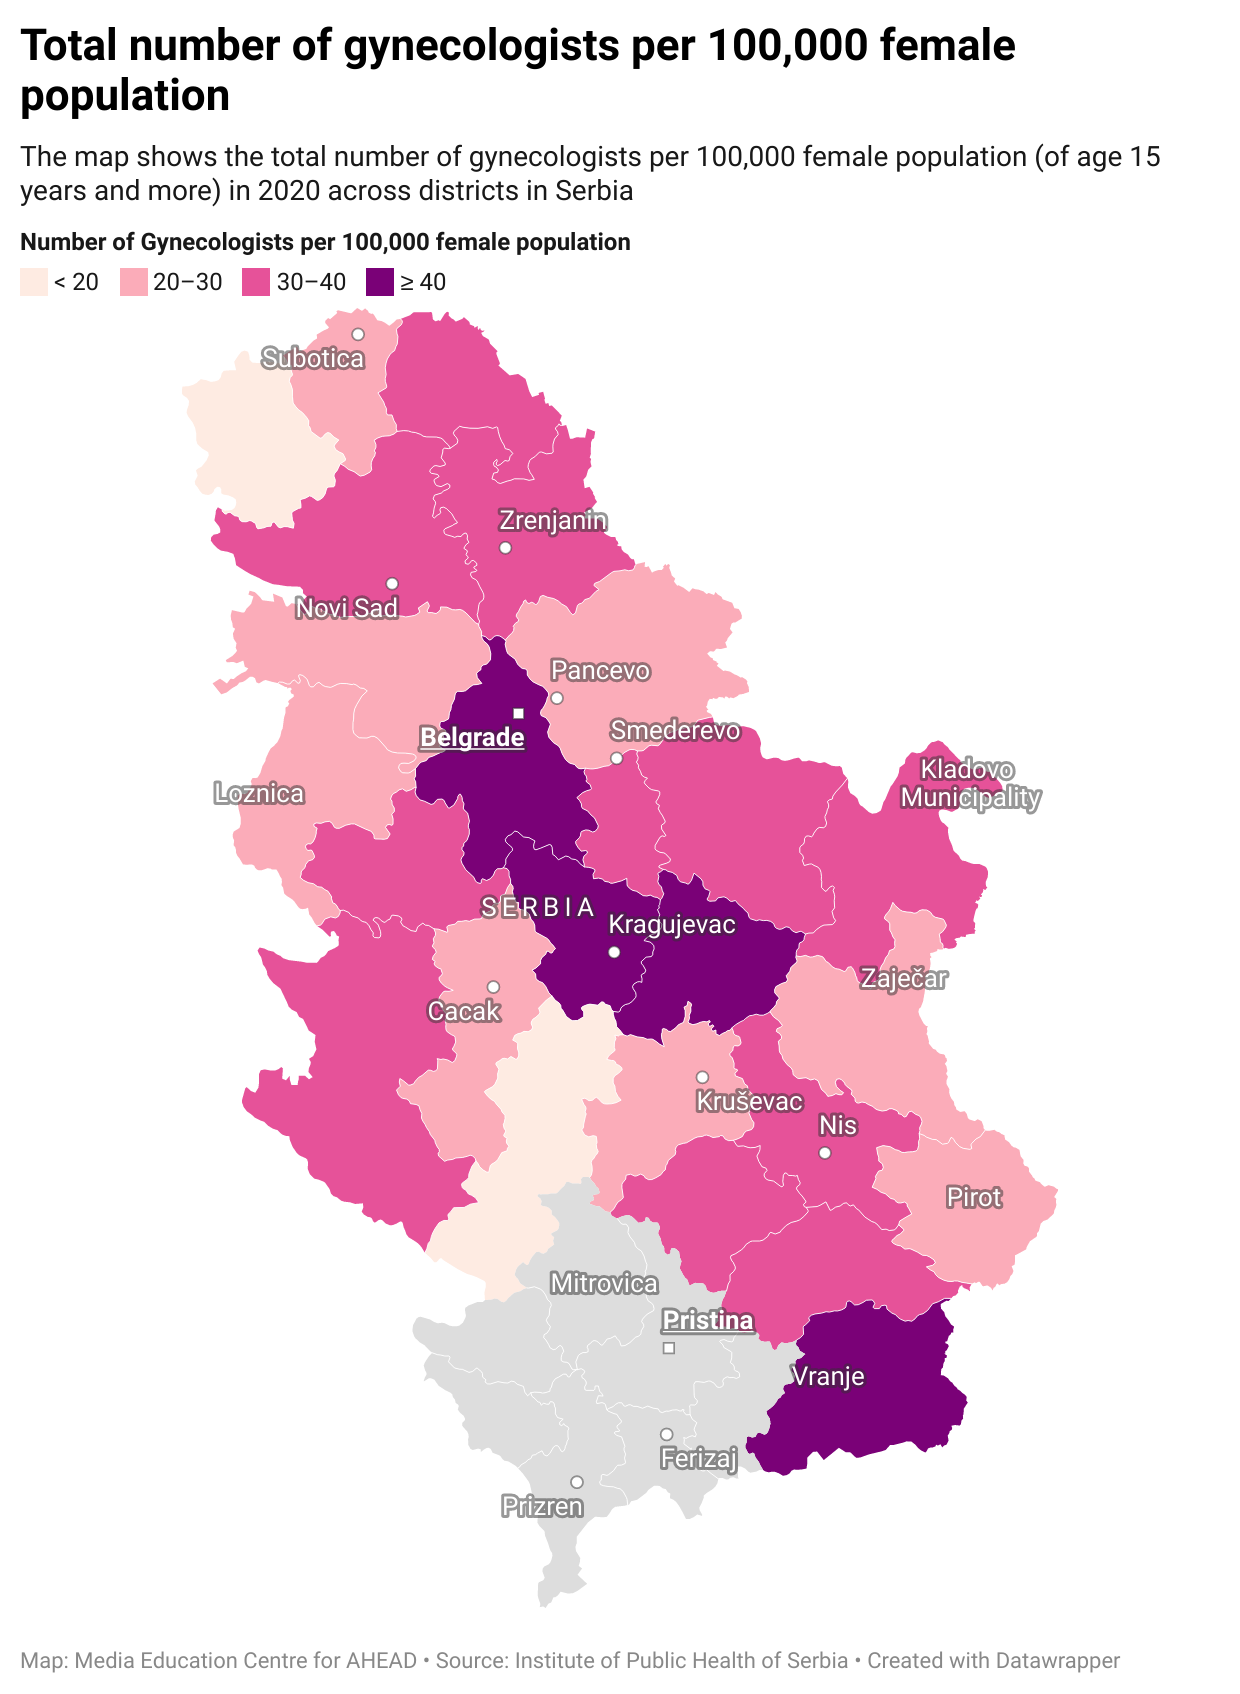
Map 6: Total number of gynaecologists per 100,000 female population
This map shows the total number of gynecologists per 100,000 female population (of age 15 years and more) in 2020 across districts in Serbia.
The source of data is the Institute of Public Health of Serbia. Health Statistical Yearbook 2020. Belgrade: IPHS, 2021.
The districts with the lowest number of general practitioners per 100,000 population over 20 years old are, Toplički, Kolubarski, Mačvanski, Borski, Moravički, and Podunavski (in red). The number of general practitioners per 100,000 population over 20 years old in these districts ranges from 34 to 39. For more information click on MAP 2 or HERE!
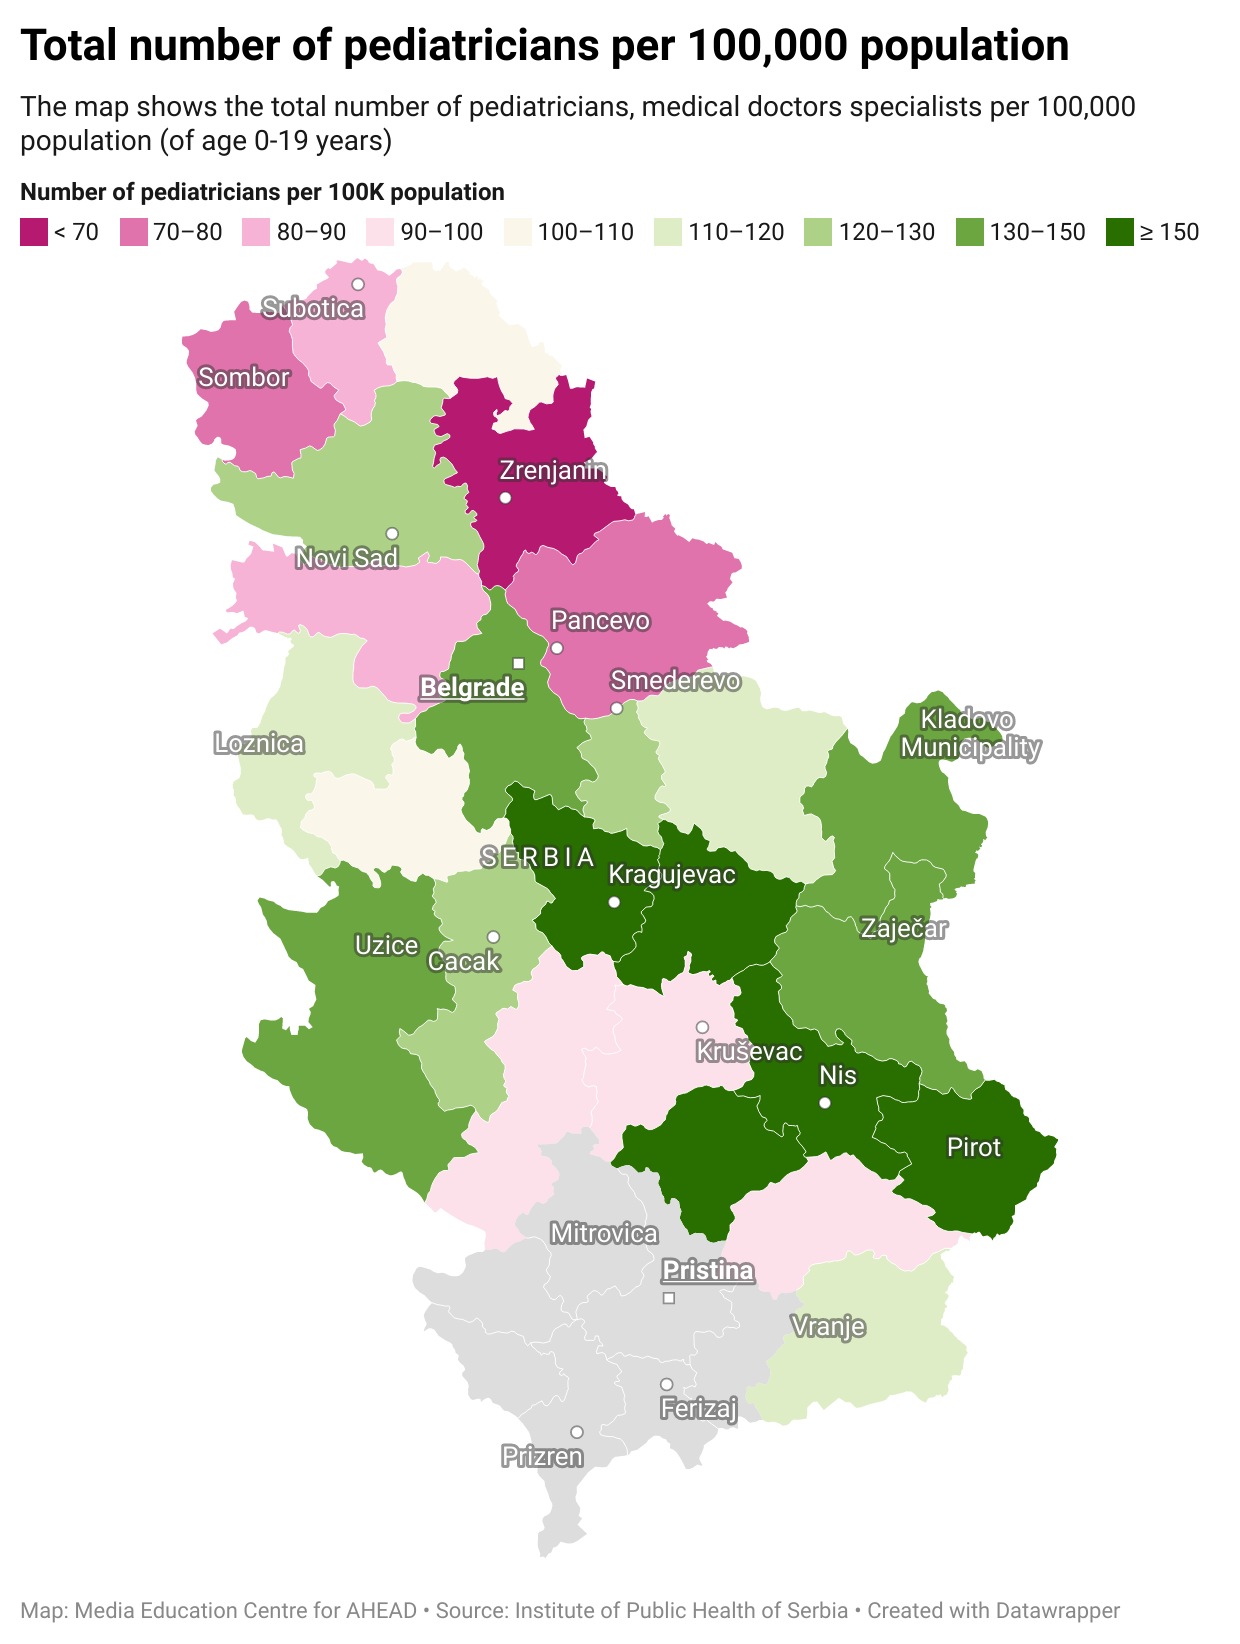
Map 7: Total number of pediatricians, medical doctors specialists per 100,000 population
This map shows the total number of pediatricians, medical doctors specialists per 100,000 population (of age 0-19 years) in 2020 across districts in Serbia.
Source: Institute of Public Health of Serbia. Health Statistical Yearbook 2020. Belgrade: IPHS, 2021
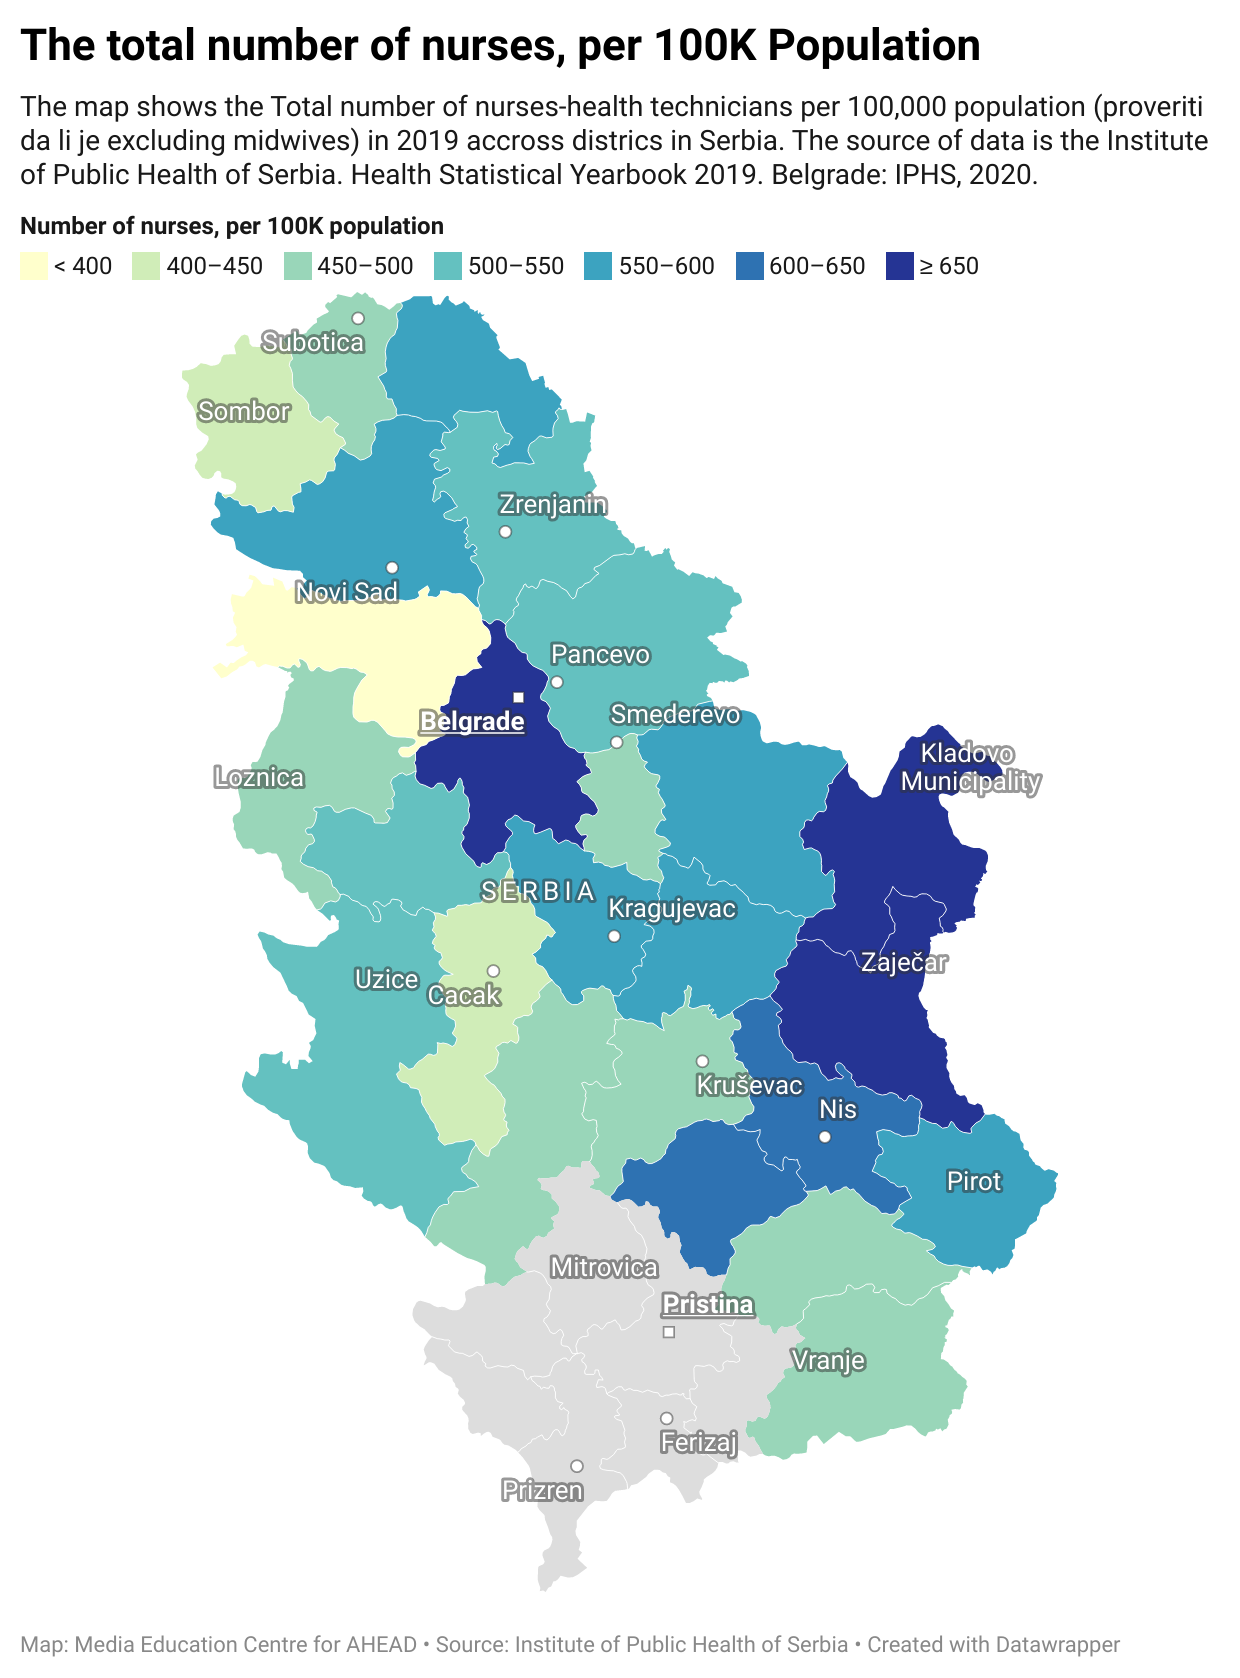
Map 8: The total number of nurses, per 100K Population
The map shows the Total number of nurses-health technicians per 100,000 population in 2019 across districts in Serbia.
The source of data is the Institute of Public Health of Serbia. Health Statistical Yearbook 2019. Belgrade: IPHS, 2020...
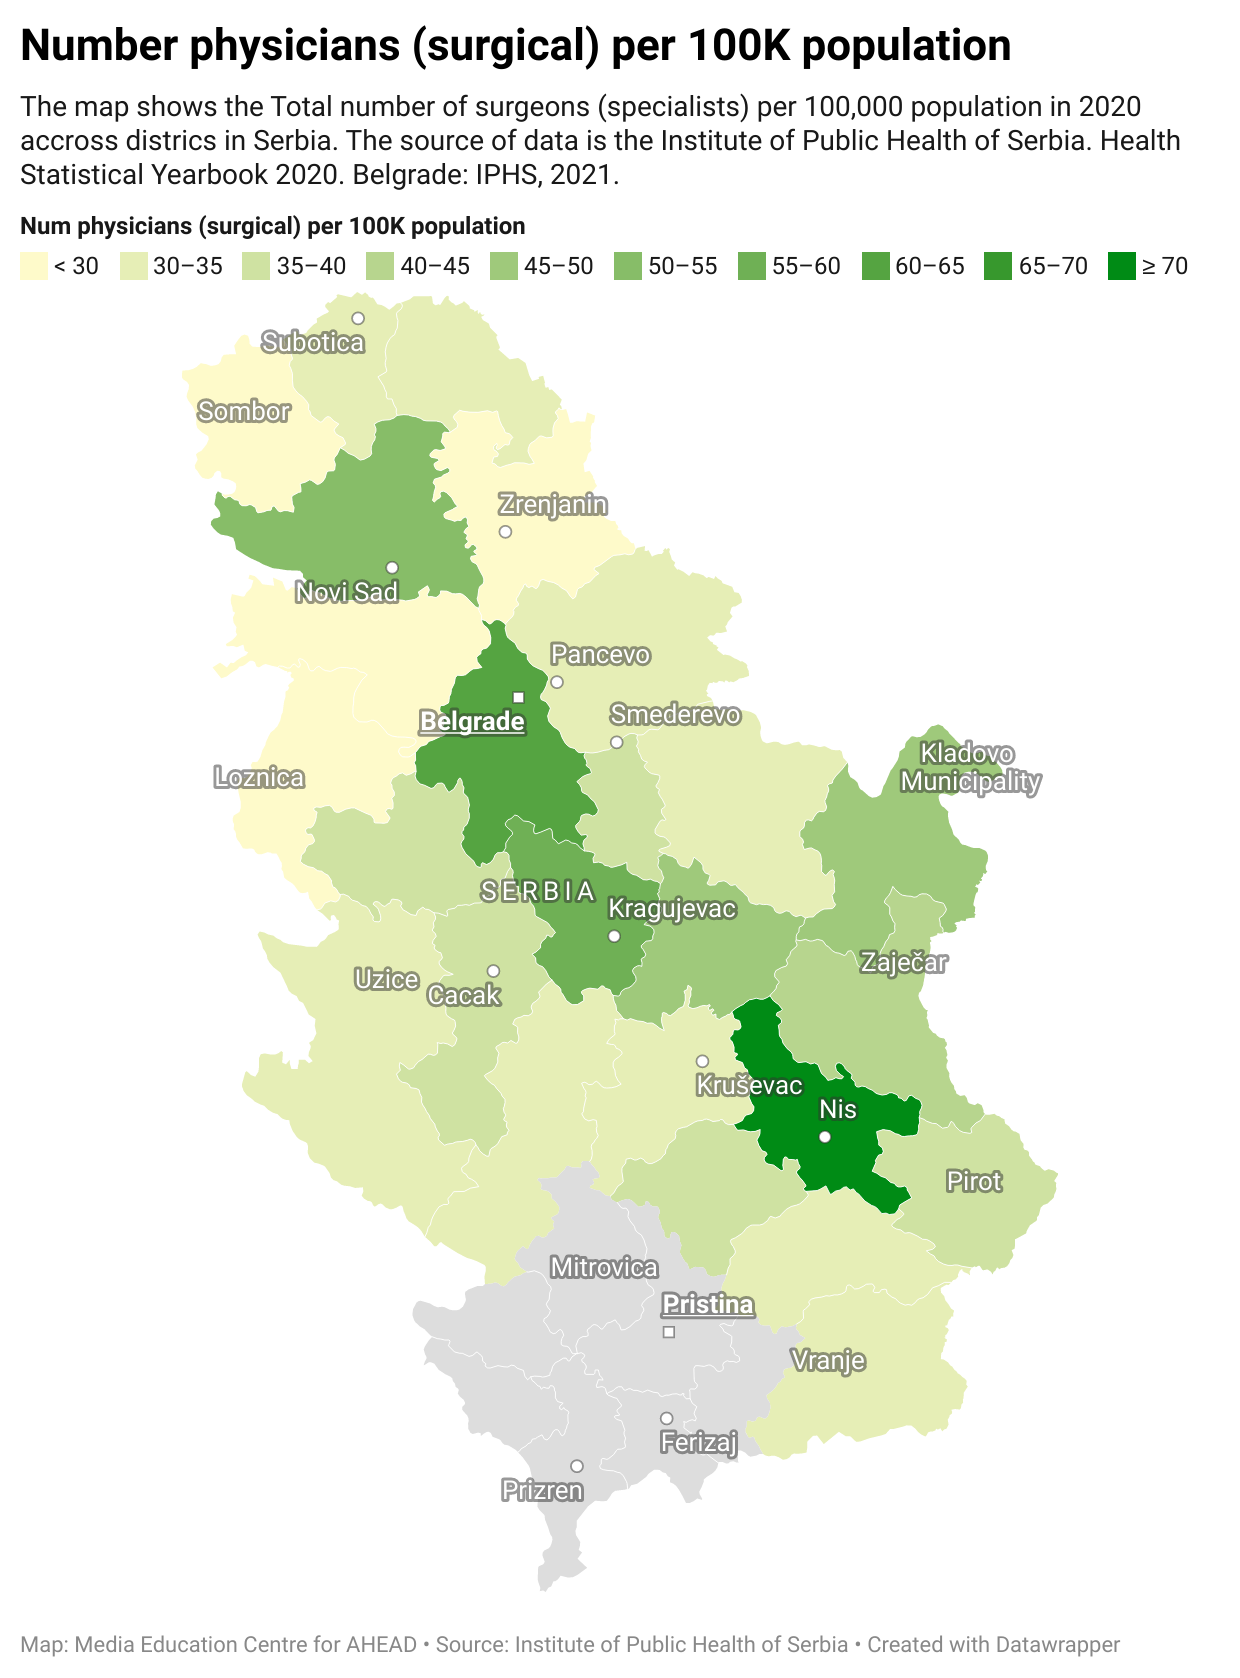
Map 9: Total number of physicians (surgical) per 100,000 population
The map shows the Total number of surgeons (specialists) per 100,000 population in 2020 across districts in Serbia.
The source of data is the Institute of Public Health of Serbia. Health Statistical Yearbook 2020. Belgrade: IPHS, 2021.